Category: Money Moves Markets

  • UK MPC policy pivot approaching as labour market cracks

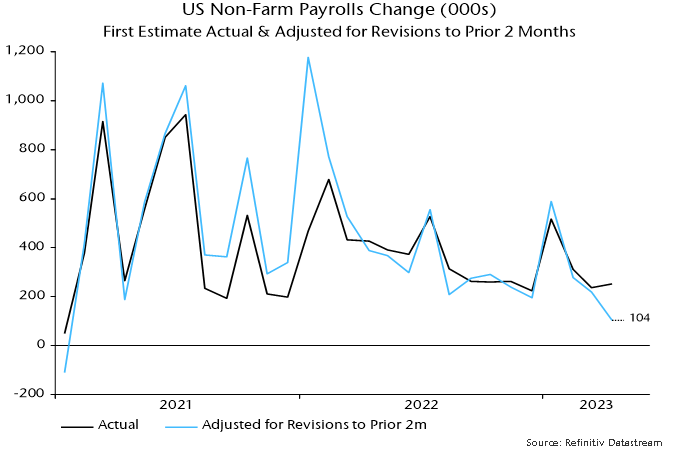
    Commentators have expressed scepticism about a large monthly fall in the “experimental” PAYE employees measure in April (136,000 or 0.45%, equivalent to a 700,000 drop in US non-farm payrolls).

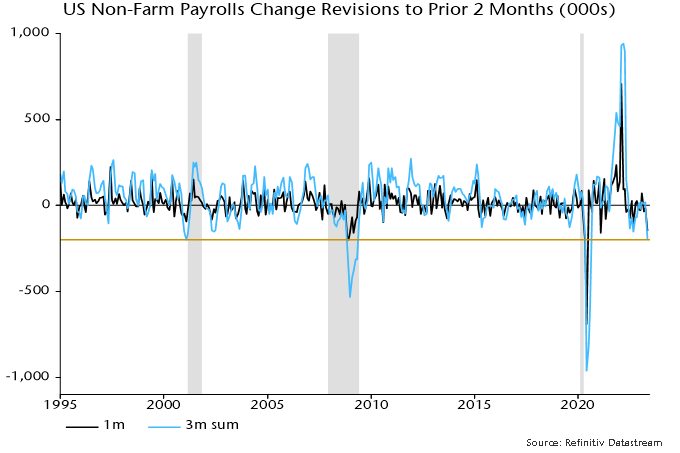
    It is true that initial estimates are often revised significantly but the largest upward adjustment to the month-on-month change historically was 121,000, relating to a pandemic-distorted month (March 2021*). The mean absolute revision over the last year was 34,000.

    The recent trend, moreover, has been for downgrades – the initially estimated month-on-month change has been revised lower for five of the last six months.

    The reported fall is consistent with the latest KPMG / REC Report on Jobs: the permanent placements index in April was the lowest since the start of 2021 and the PAYE measure last declined in February 2021 (based on current vintage data).

    The regional breakdown of the PAYE measure shows falls in all 12 regions, with the largest (1.0%) in London – also consistent with the Report on Jobs, which reported that permanent placements weakness was led by London.

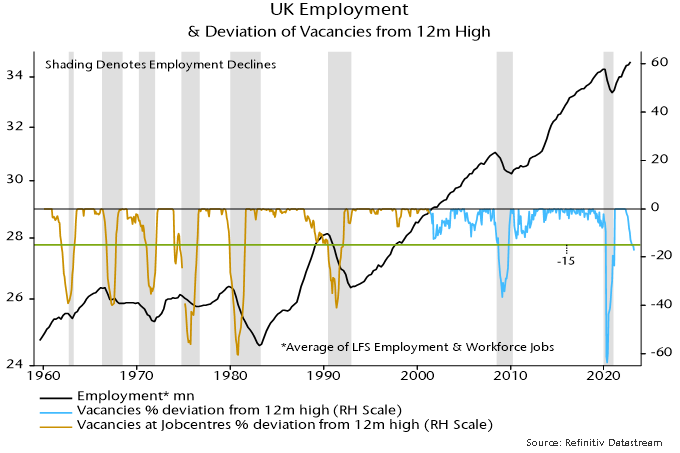
    As the chart shows, the PAYE employees measure correlates with the quarterly employee jobs series, which has “official” status but is less timely – an end-Q1 number will be released next month. (This series, like US payrolls, counts positions rather than people.)

    The Labour Force Survey employment measure rose by 182,000 in the three months to March from the previous three months but self-employment and part-time employees accounted for the increase – the number of full-time employees fell.

    A post last week suggested that employment would begin a sustained decline in Q2, based on recent weakness in vacancies. The official vacancies series – a three-month moving average – fell again in April. The single-month number calculated here is now down 20% from peak (April 2022), with the month-on-month decline accelerating last month. (The FT incorrectly reported that vacancies stabilised in April.)

    Another labour market report is due before the MPC’s next meeting on 22 June. Confirmation that employment is on a falling trend would transform the policy debate.

    *The revision to the month-on-month change reflected a downgrade to the level of employment in February, not an upgrade to March.

    —–
    COMMENT:
    AUTHOR: David Cotton
    EMAIL: mrwbartholomew@gmail.com
    IP: 78.129.191.50
    URL:
    DATE: 05/17/2023 03:37:39 PM

    My guess is the MPC will focus on the LFS and the supposed enormous number or vacancies relative to history.

    The Fed will probably cut first and then the others will follow. Suddenly they won't be able to cut fast enough?

    Policy makers are seemingly convinced we're in the 1970s. Money trends of course are nothing like then…

  • Recession warning from UK vacancies

    UK vacancies – like US job openings – are signalling an employment recession. 

    A previous post noted that a fall in US job openings of more than 15% from a rolling 12-month high was always (since the 1950s) associated with a multi-month fall in payrolls. The 15% threshold was crossed in February data released last month, with the shortfall increasing to 18% in March.

    It turns out that the 15% rule also works in the UK, correctly signalling all eight employment recessions since the 1960s with no false warnings. Recent developments mirror the US: the decline in vacancies from peak crossed 15% in January, rising to 17% in March.

    The official vacancies series, based on a survey of employers, starts in 2001. Earlier numbers are available (back to 1960) for vacancies notified to Jobcentres. When the latter series was replaced in 2001, Jobcentre vacancies accounted for about 60% of the total. The analysis here combines the two series, effectively assuming that Jobcentre vacancies were a constant proportion of the total before 2001.

    Employment recessions were defined as multi-quarter declines in an average of two series – total employment (from the Labour Force Survey of households) and workforce jobs (based mainly on a survey of employers). The latter series – like US non-farm payrolls – counts positions rather than workers and is about 10% larger, reflecting multiple job holding. 

    As in the US, the 15% threshold was usually reached around the time that employment started to decline, although this may not have been immediately apparent because of reporting lags and revisions.

    A Q1 reading of the total employment series is not yet available but LFS data through February and PAYE employee numbers suggest another rise. Based on the vacancies signal, a sustained decline may begin in Q2.

    —–
    COMMENT:
    AUTHOR: David Cotton
    EMAIL: mrwbartholomew@gmail.com
    IP: 78.129.191.50
    URL:
    DATE: 05/12/2023 02:30:35 PM

    Yet central banks still blithely raise interest rates. This situation is really quite incredible.

  • Capex weakness to drive PMI double dip

    The global manufacturing PMI new orders index – a timely indicator of global goods demand – was little changed below 50 (49.4) in April, a weaker result than had been suggested by DM flash results. 

    Inventories indices for finished goods and production inputs, meanwhile, rose further to their highest levels since November. Accordingly, new orders / inventories differentials – which often lead at turning points – fell for a second month. 

    These results are consistent with the forecast here that a recovery in PMI new orders since December 2022 would fizzle out in H1 and reverse into H2, with a possibility of a break below the December low. The basis for the forecast was a relapse in global (i.e. G7 plus E7) six-month real narrow money momentum around end-2022. Real money momentum moved sideways in March at around its June 2022 low – see chart 1.

    Chart 1

    A downswing in the stockbuilding cycle was a key driver of earlier PMI weakness. A further drag is in prospect but the down phase of the cycle is well advanced, with incoming data and average cycle length suggesting a low during H2. 

    Business capex is emerging as a new source of global goods demand weakness. The capital goods component of PMI new orders reached a new low in April – chart 2. 

    Chart 2

    A contraction in business investment is consistent with a squeeze on real profits in late 2022 – chart 3 – and weak corporate money trends: business broad money holdings have fallen in nominal terms recently in the US, Eurozone and UK – chart 4. 

    Chart 3

    Chart 4

    Other evidence of a capex downturn includes: 

    • Weak capex intentions in regional Fed manufacturing surveys (and the NFIB small firm survey) – chart 5.  

    • Weak enterprise loan demand for fixed investment in the ECB bank lending survey – chart 6.  

    • Falling capital goods / machinery orders in the US, Japan and Germany – chart 7.

    Chart 5

    Chart 6

       Chart 7

    Capex retrenchment is usually accompanied by a fall in labour demand. Adjusted for negative revisions to the prior two months, the addition to US non-farm payrolls in April was 104,000, the smallest since January 2021 – chart 8. Revisions in the last three reports cumulate to -200,000, a level rarely reached outside recessions – chart 9.

    Chart 8

    Chart 9

    —–
    COMMENT:
    AUTHOR: David Cotton
    EMAIL: mrwbartholomew@gmail.com
    IP: 82.132.230.138
    URL:
    DATE: 05/10/2023 02:41:17 PM

    When else have we seen broad money contract nominally?

    I can only think of one. Will it be different this time? Hopefully!

  • Global supply glut signalling goods deflation

    The “monetarist” forecast is that G7 inflation rates will fall dramatically into 2024, mirroring a collapse in nominal money growth in 2021-22.

    G7 annual broad money growth returned to its pre-pandemic (2015-19) average of 4.5% in mid-2022. Based on the rule of thumb of a two-year lead, this suggests that annual inflation rates will be around pre-pandemic levels in mid-2024. More recent broad money stagnation signals a likely undershoot.

    Pessimists argue that inflation will prove sticky because of high wage growth. Wages are a coincident element of the inflationary process. Low (but rising) wage growth didn’t prevent the 2021-22 inflation surge and high (but moderating) growth isn’t an obstacle to a substantial fall now.

    The 2021-22 inflation surge was initially driven by excess demand for goods, due to a combination of covid-related supply disruption, associated precautionary overbuilding of inventories, a spending switch away from services and – most importantly – excessive monetary / fiscal stimulus.

    Excess goods demand was reflected in a plunge in the global manufacturing PMI supplier delivery speed index to a record low. This plunge predated the inflation surge by about a year versus a two-year lead from money – see chart 1.

    Chart 1

    The reverse process is now well-advanced, with supply normalising, firms running down excess inventories, the services spending share rebounding and monetary policies far into overrestrictive territory. The PMI delivery speed index is at its highest level since the depths of the 2008-09 recession, signalling substantial excess goods supply.

    Global goods prices are heading into deflation. Chinese reopening has added to excess supply and Asian exporters are already lowering prices in the US – chart 2. Chinese producer prices are falling and the renminbi is competitive, with JP Morgan’s PPI-based real effective rate at its lowest level since 2011. Other Asian currencies are similarly weak.

    Chart 2

    The global manufacturing PMI output price index lags and correlates negatively with the delivery speed index. It has plunged from 64 to 53 and is likely to cross below 50 soon. The current prices received balance in the US Philadelphia Fed manufacturing survey turned negative (equivalent to sub-50 in PMI terms) in April, the weakest reading since the 2020 recession.

    Global goods deflation will squeeze profits and wage growth in that sector, with knock-on effects on services demand, pay pressures and pricing.

    Central bankers are once again asleep at the wheel, pursuing procyclical polices that amplify economic volatility and impose unnecessary costs.

    —–
    COMMENT:
    AUTHOR: Stefano F.
    EMAIL: sfeltre@fideuram.it
    IP: 193.227.215.157
    URL:
    DATE: 04/24/2023 09:24:54 AM

    Has the balance sheet total of the G7 central banks increased since October 2022? Is this what lifted stock markets and economies?

    —–
    COMMENT:
    AUTHOR: Emma Wilkinson
    EMAIL: ewilkinson@westburyam.co.uk
    IP: 82.69.37.168
    URL:
    DATE: 04/24/2023 11:02:39 AM

    Following your work closely, thank you Simon.

    What are your thoughts about Tech from here? If quality is sought due to over-restrictive Fed causing a recession, do you think some parts of Tech (large co with lots of cash on balance sheets) could outperform, whilst non-profit tech continues to struggle? I would expect credit spreads to widen further from here, I'd be interested to know if you agree?

    Many thanks
    Emma

    —–
    COMMENT:
    AUTHOR: Simon Ward
    DATE: 04/25/2023 03:14:01 PM

    Stefano – The Fed’s balance sheet expanded in March because of the banking crisis but is still down vs. October. The ECB’s balance sheet has contracted because of TLTRO repayments. The BoJ’s balance sheet is up but not by enough to offset the Fed / ECB falls.

    Emma – The tech rally isn’t supported by the latest excess money readings and the sector signal may outweigh the style signal, i.e. there's a case for avoiding overweighting even quality tech. Similar environments historically have been associated with rising credit spreads but a Treasury rally could support absolute returns.

  • Moderate Chinese recovery won’t offset weakness elsewhere

    The Chinese economy has bounced back since reopening but the pick-up has arguably been underwhelming. GDP grew at a 9.1% annualised rate in Q1, according to official data, but this partly represents payback for a weak Q4. Growth averaged an unexceptional (by Chinese standards) 5.7% over the two quarters. 

    Inflationary pressures remain weak despite the activity rebound. Nominal GDP expansion was only marginally higher than real in Q4 / Q1 combined: the GDP deflator rose by just 0.4% annualised – see chart 1*. 

    Chart 1

    Muted nominal GDP growth has contributed to lacklustre profits, with the IBES China earnings revisions ratio diverging negatively from recent stronger official PMIs, questioning the sustainability of the latter – chart 2. 

    Chart 2

    Monthly activity numbers for March were mixed and don’t suggest a pick-up in momentum at quarter-end. Retail sales were a bright spot but strength in industrial output, fixed asset investment and home sales has faded after an initial reopening bounce – chart 3. 

    Chart 3

    Moderate nominal GDP expansion is consistent with recent narrow money trends: six-month growth of true M1 (which corrects the official M1 measure to include household demand deposits) remains range-bound and slightly below its 2010s average – chart 4**. 

    Chart 4

    Broad money growth, as the chart shows, is significantly stronger. However, examination of the “credit counterparts” indicates that a rise since late 2021 has been driven mainly by banks switching to deposit funding and reducing other liabilities – domestic credit expansion has been stable. 

    The judgement here is to place greater weight on narrow money trends, which currently suggest a moderate recovery that probably requires additional policy support to offset external headwinds. 

    *Official unadjusted nominal GDP seasonally adjusted here; GDP deflator derived from comparison with official seasonally adjusted real GDP.

    **March true M1 estimated pending release of demand deposits data.

    —–
    COMMENT:
    AUTHOR: David Cotton
    EMAIL: mrwbartholomew@gmail.com
    IP: 78.129.191.50
    URL:
    DATE: 04/25/2023 02:38:01 PM

    The revisions ratio and seeming total lack of pricing power being reflected via very low inflation, does not seem to indicate a strong rebound.

  • Recession warning from US vacancies

    US February job openings were 17% below their March 2022 peak. Historically, a decline of this magnitude in vacancies – job openings or, for earlier years, help-wanted advertising – was always associated with a payrolls recession. 

    Job openings numbers are available back to 2000. Regis Barnichon, now at the San Francisco Fed, constructed a proxy series – composite help-wanted advertising – for earlier decades. The Barnichon series adjusts historical data on newspaper advertising for a rising share of online job postings, modelled by an S-curve. 

    The official and Barnichon series (which is no longer updated) can be spliced together to create a continuous vacancies series extending back to the early 1950s, a period encompassing 11 recessions involving sustained payrolls declines – see chart 1. 

    Chart 1

    Every payrolls decline was preceded by a fall in vacancies but several vacancies declines were followed by slowdowns in payrolls rather than outright weakness (e.g. 1966). 

    A sufficient condition for a payrolls recession was a fall of more than 15% in vacancies from their peak level in the latest 12 months – chart 2. This condition was met in February job openings numbers released last week. 

    Chart 2

    Historically, the 15% threshold was reached around the time that payrolls started to decline. In six of the 11 cases, payrolls had already peaked, although this was not always known at the time. 

    As an example, current data show a 1974 payrolls decline beginning in August, one month before the vacancies fall reached the 15% trigger. In real-time data, however, a payrolls peak was delayed until October.

    —–
    COMMENT:
    AUTHOR: David Cotton
    EMAIL: mrwbartholomew@gmail.com
    IP: 78.129.191.50
    URL:
    DATE: 04/14/2023 01:34:32 PM

    It certainly seems ominous that there has been no policy response as yet and it doesn't look like there will be one for a quarter or two.

    —–
    COMMENT:
    AUTHOR: Edward Xylem
    EMAIL:
    IP: 86.170.235.114
    URL:
    DATE: 04/21/2023 08:30:54 PM

    Policy steps taken are showing through and inflation will respond. The Saudi cut in oil volumes is a sign of weakness in demand, not an increase. Vacancies are flagging a slow down. Tightening credit conditions via the banking system. Commercial real-estate stress., feeding back into the banks. EPS will droop and market valuations respond. Have the monetary authorities gone too far and an undershirt to the downside on the cards?

  • Global monetary relapse ominous for H2 prospects

    Partial information indicates that global (i.e. G7 plus E7) six-month real narrow money momentum fell for a third month in March, possibly breaching a low reached in June 2022. This increases confidence that a recent recovery in PMIs will reverse into H2. 

    The June 2022 low in real narrow money momentum presaged a low in global manufacturing PMI new orders in December – see chart 1. Assuming the same six month lead, the roll-over in real money momentum since December 2022 implies a PMI decline from June. 

    Chart 1

    The fall could start earlier. The recovery in real money momentum between June and December 2022 was minor and driven entirely by a slowdown in six-month consumer price inflation. Momentum failed to break into positive territory. Credit tightening due to recent banking stresses may accelerate economic weakness. 

    The renewed fall in global real money momentum since December reflects nominal money weakness rather than any inflation rebound: the six-month rate of change of nominal narrow money appears also now to be negative, a feat never achieved during the GFC – chart 2. 

    Chart 2

    Nominal money contraction is being driven the US and Europe, with momentum positive and stable in the E7 and Japan. 

    Global real money momentum will be supported by a further inflation slowdown but a significant recovery is unlikely without a policy reversal that revives nominal money growth. As previously argued, recent reexpansion of the Fed’s balance sheet has no direct – or, probably, indirect – impact on money stock measures. 

    The fall in global real money momentum has further delayed the expected cross-over above weakening industrial output momentum, suggesting fading the Q1 equity market rally and favouring defensive sectors, quality and yield.

  • Recessionary Eurozone monetary trends

    Eurozone February monetary data were extraordinarily negative, suggesting that interest rates were already at a restrictive level before the 50 bp rate hikes in February / March. 

    Economic sentiment has lifted in early 2023 in response to a collapsing gas price and China’s reopening but the impact of monetary restriction has yet to kick in. 

    The headline M3 broad money measure was down again in February and has fallen in four of the last five months. The six-month rate of change turned negative and is the weakest since 2010 in the aftermath of the GFC – see chart 1. 

    Chart 1

    Bank deposits are contracting at a faster pace than then because of a portfolio switch into money market funds and short-term bank bonds. This switch has been motivated by relative yields but the banking crisis could give a further boost to money fund inflows. 

    Corporate money trends are particularly alarming. Bank deposits of non-financial corporations contracted at a 4.0% annualised pace in the latest three months, with the overnight (M1) component down by 16.6% – chart 2. Household deposits fell in February and are barely up over three months, with a shift out of overnight accounts suggesting weak spending intentions. 

    Chart 2

    Talk of households still sitting on substantial spendable “excess” savings is suspect. Allowing for inflation erosion, household M3 deposits are below their pre-pandemic trend – chart 3. 

    Chart 3

    Country deposit data suggest that a core / periphery divergence is opening up, with Spain following Italy into year-on-year contraction – chart 4. 

    Chart 4

    Monetary weakness partly reflects a collapse in credit growth: three-month loan momentum was running at an annualised 7.6% as recently as September but turned negative in February – chart 5. 

    Chart 5

    Corporations have been repaying short-term loans in size since November, consistent with a downswing in stockbuilding, which reached a record share of GDP in Q4. Numbers could bounce near term as firms draw down credit lines while they still can.

    —–
    COMMENT:
    AUTHOR: David Cotton
    EMAIL: mrwbartholomew@gmail.com
    IP: 82.132.230.53
    URL:
    DATE: 03/31/2023 11:58:52 AM

    Seems to me the probability is for a longer deeper recession.

    That will be the case until central banks reverse course and monetary trends turn around.

  • UK inflation still reflecting 2020-21 monetary strength

    Current monetary stagnation implies that policy-makers’ worries about a sustained inflation overshoot are as misplaced as their deflation panic in 2020 when money growth was surging.

    UK annual broad money growth peaked in February 2021. It should be no surprise that annual inflation was still riding high in February 2023, based on the “monetarist” understanding of a roughly two year lead. 

    Annual money growth, however, collapsed after February 2021. Non-financial M4 rose by 2.4% in the year to January and by only 0.9% annualised in the latest three months. 

    A consensus concern is that a coming inflation decline will fail to return it to target – one informed commentator expects stickiness at about 4%. No explanation is offered of how such a scenario is compatible with barely growing broad money. Is velocity expected to pick up, against its long-term downtrend? Or is 4% inflation projected to coexist with economic contraction of 3% pa – the implication if money growth runs at 1% pa and velocity is stable? 

    The collapse in annual money growth closely resembles a decline over 1990-93, following which annual core RPI inflation fell below 2% in H2 1994, consistent with a core CPI rate (unavailable then) of about 1% – see chart 1. 

    Chart 1

    The push-back to a similar scenario now is that the unemployment rate is much lower than at the start of the 1990-92 recession. Average earnings growth, however, was significantly higher then – the annual increase in total pay was above 10% (three-month moving average) when the recession started versus below 6% now. Private pay momentum is already slowing despite limited labour market cooling to date – chart 2. 

    Chart 2

    The 1991-1994 inflation plunge, moreover, occurred despite upward pressure on import prices from a 12% drop in the effective exchange rate between 1990 and 1993 (calendar year averages). There is no such currency headwind to an inflation decline now. 

    Annual core CPI inflation rose in February but three-month momentum remains well down from its May 2022 peak – chart 3. Commodity prices signal a coming slowdown in food inflation – chart 4 – while energy prices will soon be falling year-on-year. The February inflation result is irrelevant for assessing 2024-25 prospects and the MPC should ignore it. 

    Chart 3

    Chart 4

    —–
    COMMENT:
    AUTHOR: David Cotton
    EMAIL: mrwbartholomew@gmail.com
    IP: 78.129.191.50
    URL:
    DATE: 03/22/2023 04:42:41 PM

    Indeed, it seems the major policy error at the BOE and other central banks is going to continue. Deflation is currently the threat, not inflation!

  • Emergency lending isn’t monetary easing

    Lending by the Fed to depository institutions jumped from $15 billion to $318 billion between 8 and 15 March – see chart 1 (red line). The emergency loans – mostly via the discount window and via the FDIC rather than under the new Bank Term Funding Program – were the main driver of a $441 billion surge in banks’ reserves at the Fed. 

    Chart 1 

    These developments do not represent an easing of monetary conditions, except relative to a much tighter baseline that would have resulted from the Fed failing to accommodate increased demand for monetary base due to the banking crisis. 

    • Unlike QE, Fed lending to the banking system has no direct impact on money stock measures (i.e. money held by households and non-bank firms). (QE has an impact to the extent that securities are purchased from non-banks.) 

    • Unlike QE, the reserves rise is temporary and will reverse if the crisis abates and lending is repaid. 

    • The emergency / temporary nature of the lending / reserves rise implies no incentive for banks currently experiencing inflows to expand assets. (QE can have secondary monetary effects by encouraging lending / securities purchases.) 

    Resolution of the crisis requires the authorities to arrest broad money contraction. A run-down of the Treasury’s cash balance at the Fed won’t be sufficient; QT needs to be suspended / reversed to offset a cutback in lending by troubled banks. Consideration should also be given to limiting the drain of deposits to money funds, e.g. by capping their access to Fed’s overnight reverse repo facility.