A modest upside inflation surprise in March has been portrayed as confirming that inflationary pressures remain sticky, warranting further delay in policy easing.
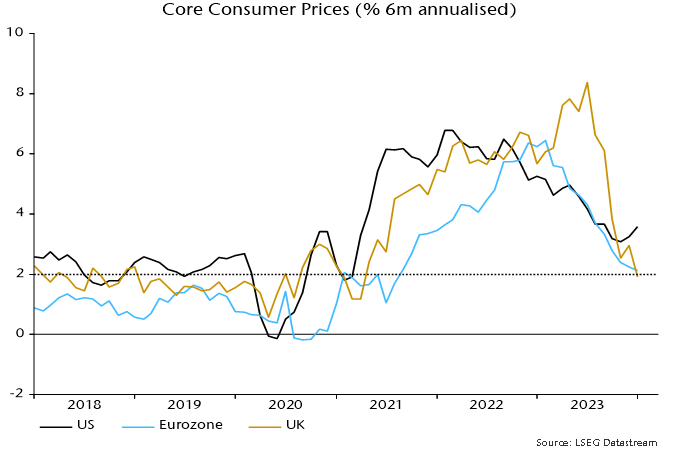
The stickiness charge is bizarre in the context of recent aggregate data. The six-month rate of change of core consumer prices, seasonally adjusted, has fallen from a peak of 8.4% annualised in July 2023 to 2.4% in March – see chart 1.
Chart 1
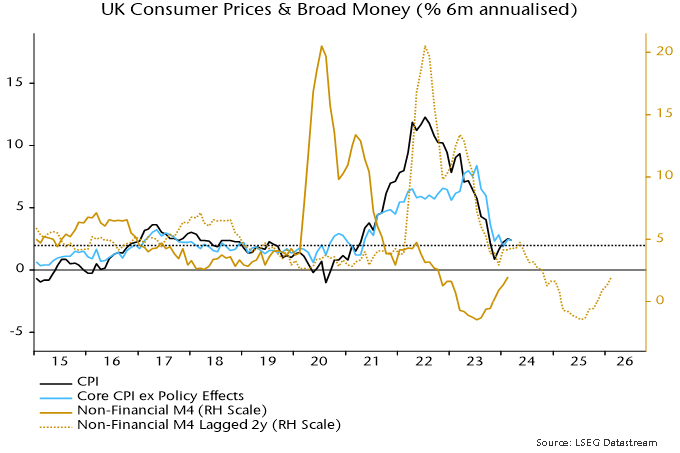
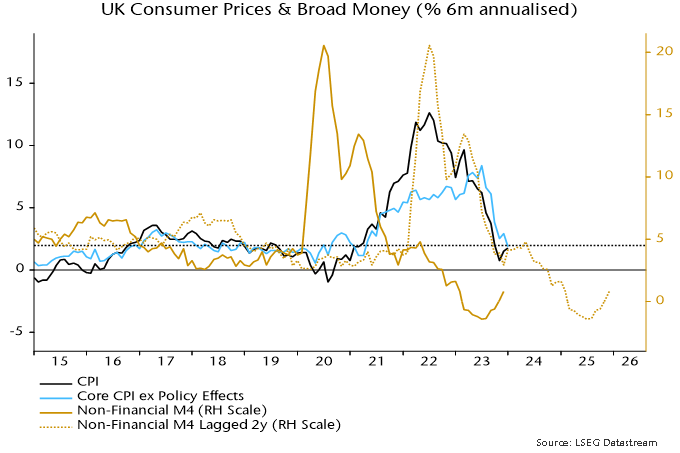
Six-month momentum, admittedly, has moved sideways over the last four months. This mirrors a pause in the slowdown in six-month broad money growth in early 2022, with the relationship suggesting a resumption of the core downtrend from around May.
Claims of stickiness focus on measures of core services momentum. Such measures gave no forewarning of the inflation upswing and are unsurprisingly also lagging in the downswing.
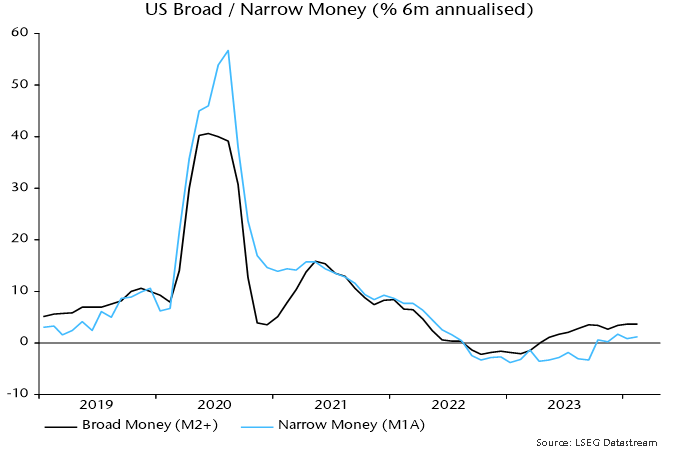
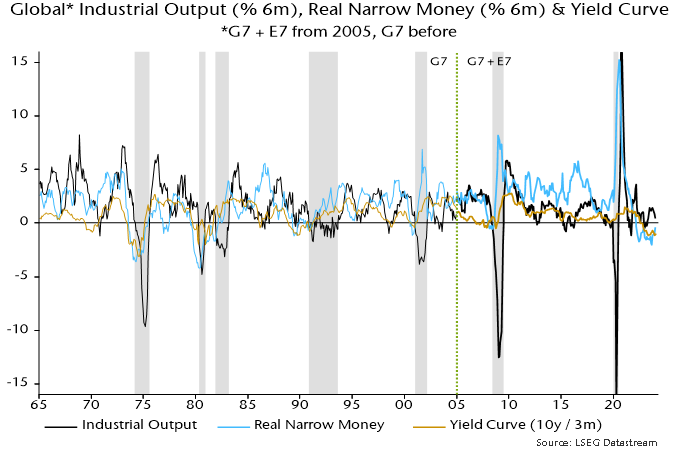
“Monetarist” theory is that monetary conditions determine trends in nominal spending and aggregate inflation, with the goods / services split reflecting relative demand / supply considerations.
Global goods prices have been under downward pressure because of rising supply and falling input costs (until recently), resulting in a diversion of nominal demand and pricing power to services.
So a monetarist forecast is that a recovery in goods momentum is likely to be associated with faster services disinflation within a continuing aggregate inflation downswing.
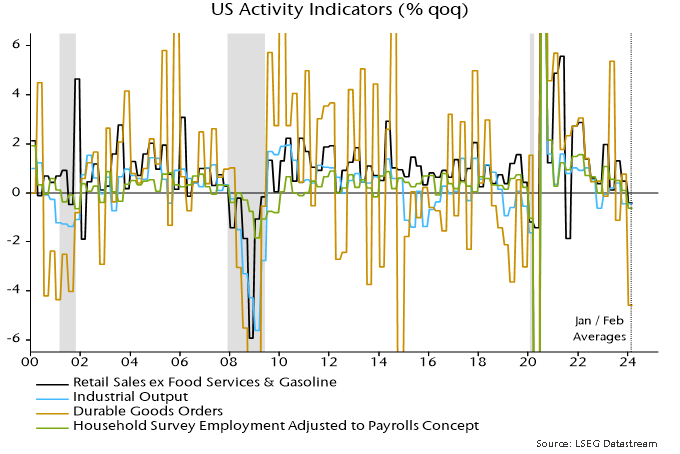
A subsidiary argument to the sticky inflation view is that the MPC can afford to be cautious about policy easing because the economy is regaining momentum.
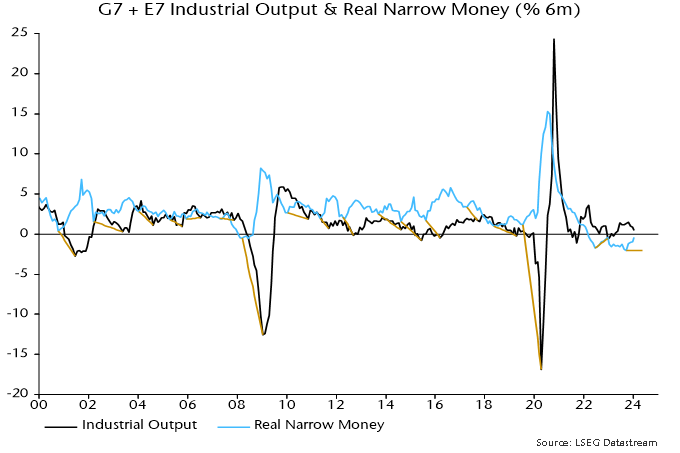
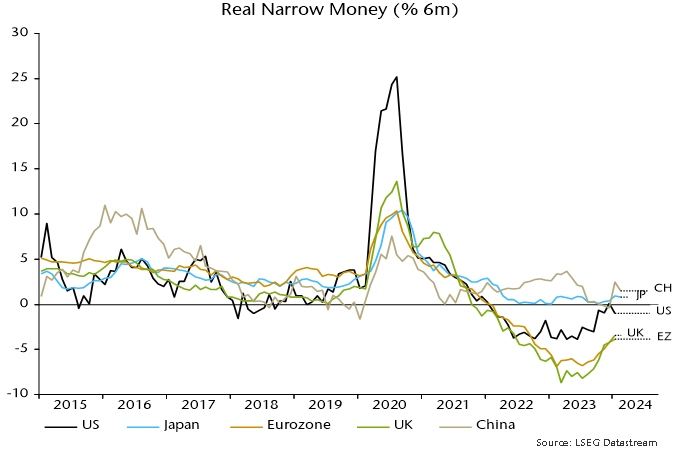
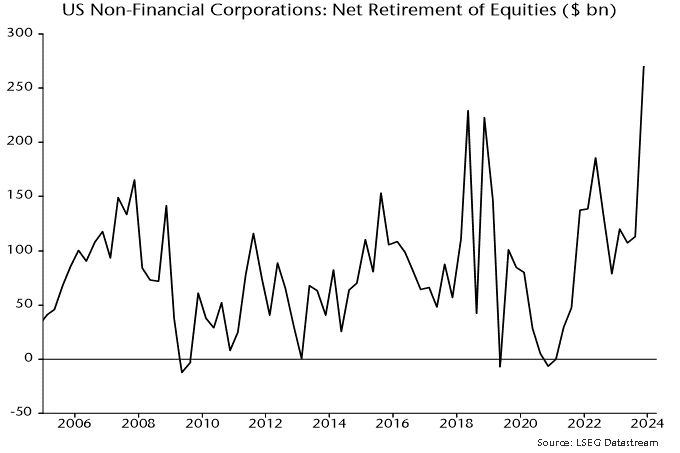
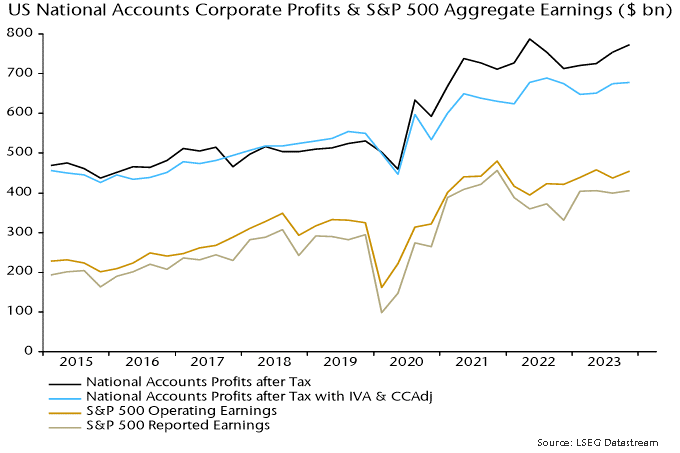
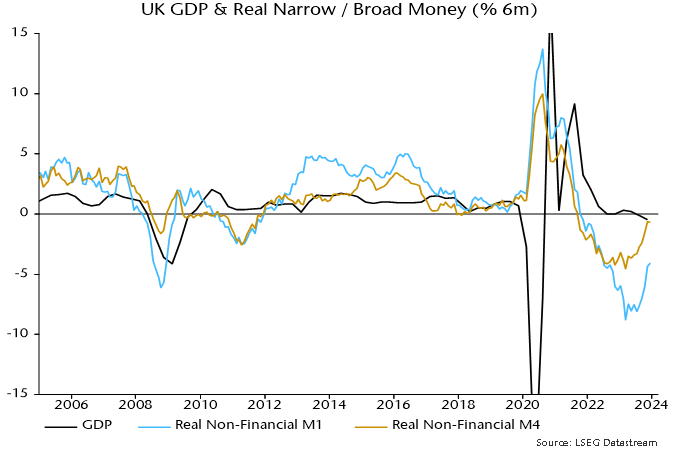
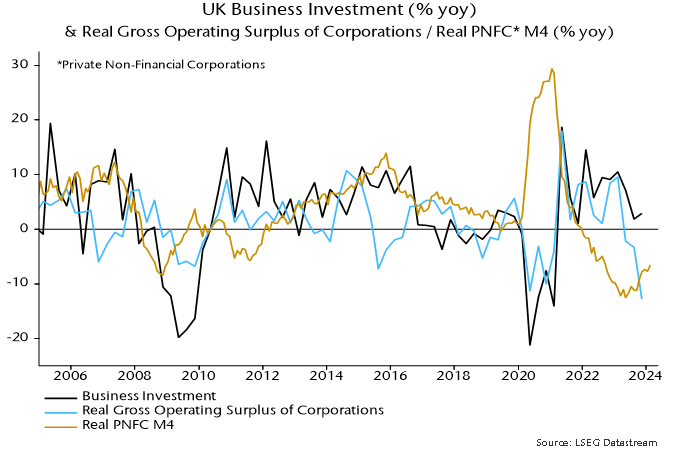
Monetary trends have yet to support a recovery scenario. Of particular concern is a continued contraction in corporate real money balances, which chimes with weakness in national accounts profits data and suggests pressure to cut investment and jobs – chart 2.
Chart 2
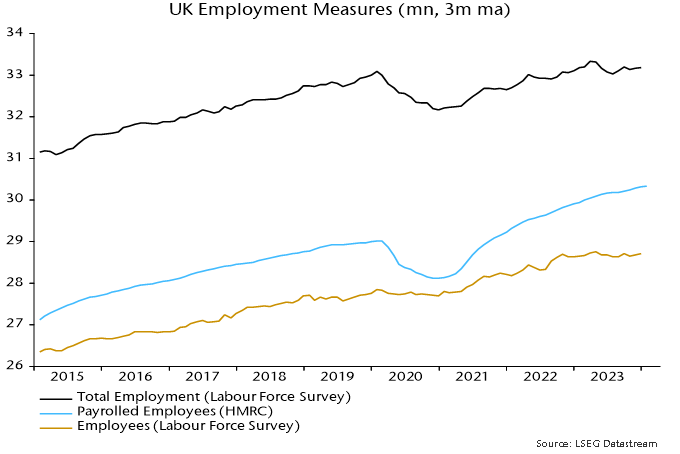
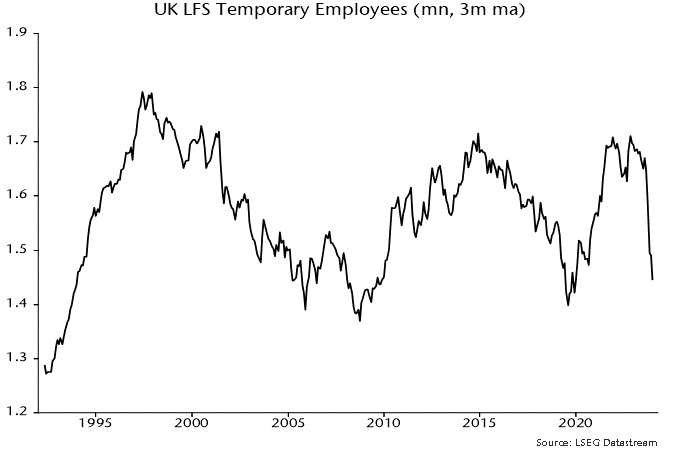
The latest labour market numbers hint at negative dynamics. LFS employment (three-month moving average) fell sharply in December / January and is now down 346,000 from a March 2023 peak. Private sector weakness has been partly obscured by solid growth of public sector employment – up by 140,000 or 2.5% in the year to December.
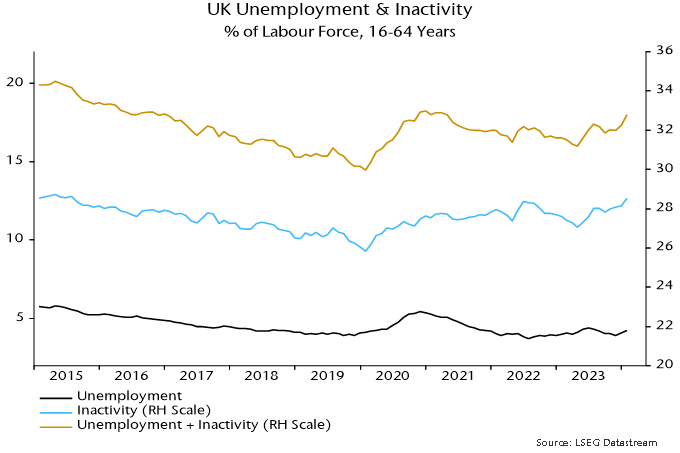
Ugly unemployment headlines have been avoided only because of a sharp fall in labour force participation. The unemployment rate of 16-64 year olds would have risen by 1.2 pp rather than 0.3 pp over the last year if realised employment had been accompanied by a stable inactivity rate – chart 3.
Chart 3
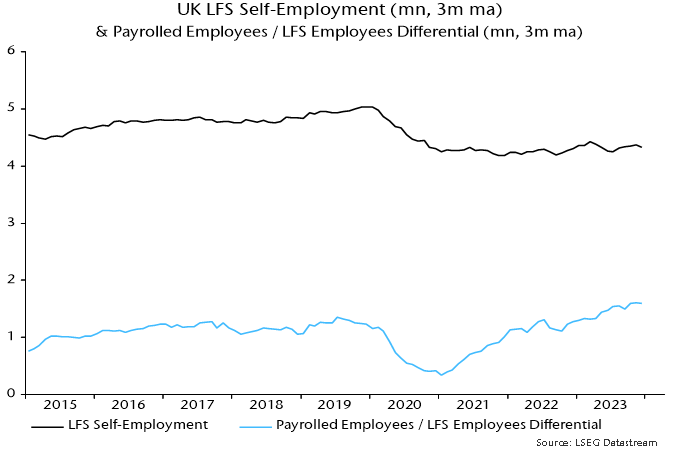
Claims of labour market resilience rest partly on the HMRC payrolled employees series but this fell for a second month in March, although numbers are often revised significantly. (A previous post argued that this series has been distorted upwards by rising inclusion of self-employed workers in PAYE.)
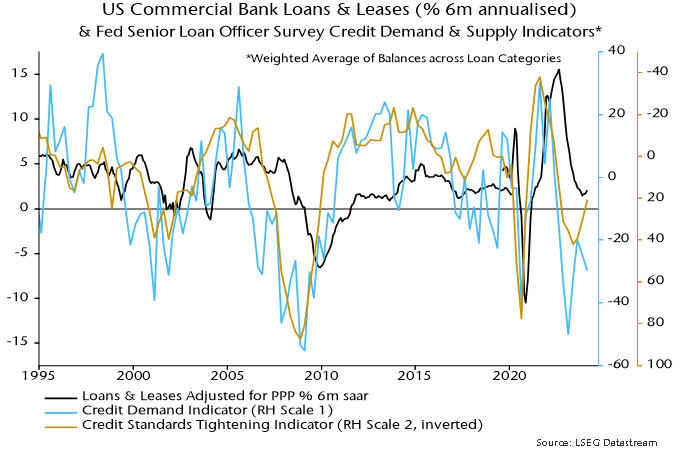
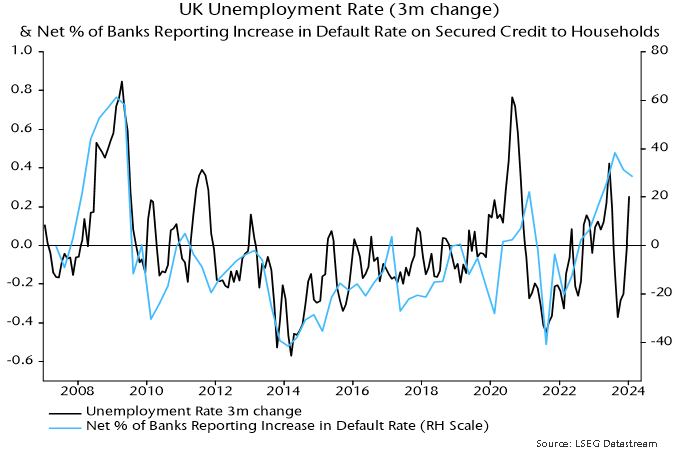
A recent revival in housing market activity, meanwhile, could prove short-lived unless mortgage rates resume a downtrend soon. The latest Credit Conditions Survey signalled that banks plan to expand loan supply in Q2 but the balance (seasonally adjusted) expecting stronger demand fell back sharply – chart 4. Majorities continue to report and expect higher defaults, consistent with gathering labour market weakness – chart 5.
Chart 4
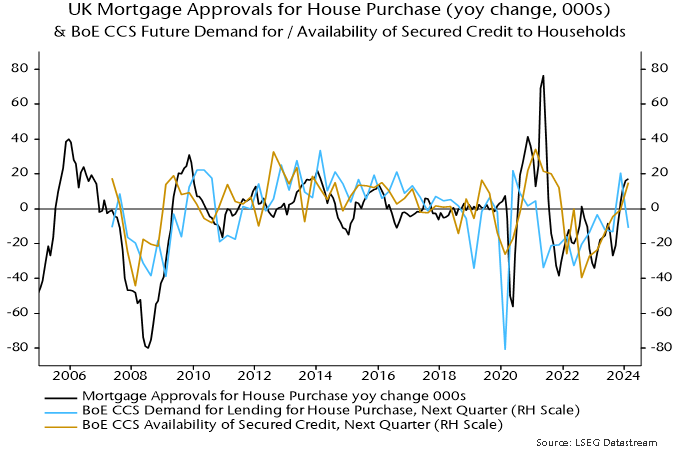
Chart 5
—–
COMMENT:
AUTHOR: David Cotton
EMAIL:
IP: 78.129.191.50
URL:
DATE: 04/19/2024 10:18:59 AM
The Fed and the BOE are too focused on what "this time" is likely to be transitory inflation through H1.
Excess money from Covid fiscal stimulus has let monetary policy stay tighter much, much longer than it could have done pre 2020 without Macro crashing. Lulling policy makers in to a false sense of security..?
US household survey full time and total employment shows similar or even more marked weakness.