Category: Money Moves Markets

  • Puzzling Chinese money market developments

    The PBoC has, ostensibly, been easing monetary policy – it reduced official rates in August, cut reserve requirements in September and has been injecting large sums in its regular lending operations. Yet three-month SHIBOR has risen since late August and is almost back to its March high – see chart 1. What’s going on? 

    Chart 1

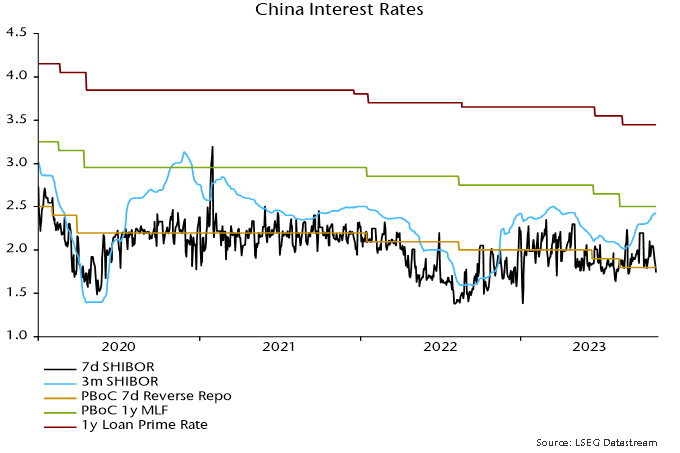
    The rise in rates indicates that money market conditions have tightened despite the PBoC’s actions. This could reflect 1) other contractionary influences on bank reserves that have offset the PBoC’s expansionary measures and / or 2) increased reluctance of banks with excess reserves to lend to liquidity-short market participants, i.e. a reduced velocity of circulation of reserves. 

    Explanation 1) appears to be at least part of the story. The latest published PBoC balance sheet is for end-September. The PBoC expanded its lending to banks by CNY1.47 trillion between end-June and end-September but bank reserves fell by CNY550 billion over this period – chart 2. 

    Chart 2

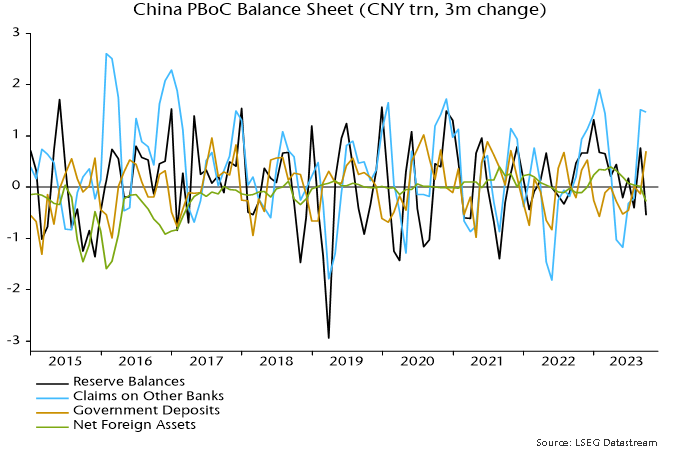
    The PBoC’s injections were offset by: 

    • A rise in currency in circulation of CNY420 billion (i.e. banks swapped reserves of this value for currency on behalf of their customers). 

    • A CNY930 billion increase in government deposits at the PBoC (i.e. there was “overfunding” of the budget deficit over the period, resulting in a transfer from bank reserves). 

    • A fall of CNY270 billion in the PBoC’s net foreign assets, consistent with foreign exchange intervention to support the currency (i.e. the PBoC sold dollars etc., with transactions settled by a transfer from bank reserves). 

    • Other unspecified movements within the “other assets” and “other liabilities” categories, which reduced net assets by a further CNY680 billion. 

    The PBoC has expanded its lending to banks further since end-September, judging from data on reverse repo transactions and lending via its standing and medium-term facilities, but three-month SHIBOR has continued to firm. 

    It should be emphasised that the PBoC has ultimate control over short-term interest rates because there is no theoretical or practical limit to its ability to supply additional reserves. 

    Why has it chosen to undersupply market demand for liquidity? A plausible explanation is that officials are concerned that even larger injections would increase downward pressure on the currency. 

    Foreign exchange reserves fell by $78 billion during Q3 but this overstates PBoC intervention because of valuation effects (stronger dollar, weaker Treasuries). Banks purchased a net $39 billion of foreign exchange over the three months, which is a better guide to official sales and tallies with the fall in net foreign assets on the PBoC’s balance sheet (CNY270 billion = $37 billion at a Q3 average exchange rate of 7.25). 

    The forward premium or discount on the offshore yuan is an indirect measure of pressure on the currency. The discount widened in October, which may indicate that intervention had to be stepped up – chart 3. 

    Chart 3

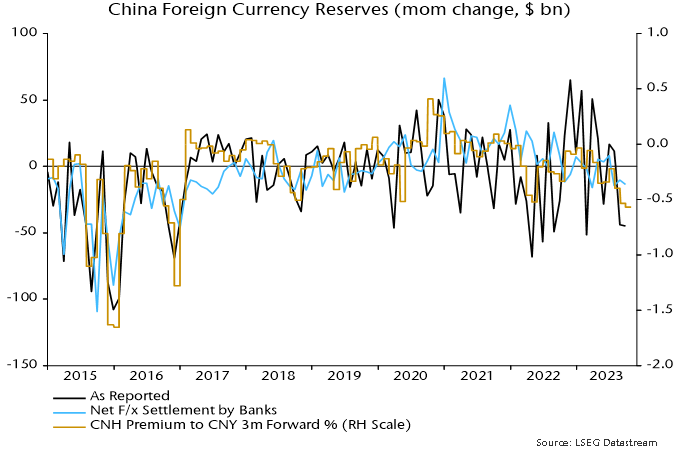
    The reserves outflow is much less than before / after the 2015 devaluation, when monthly intervention appears to have peaked at over $100 billion. 

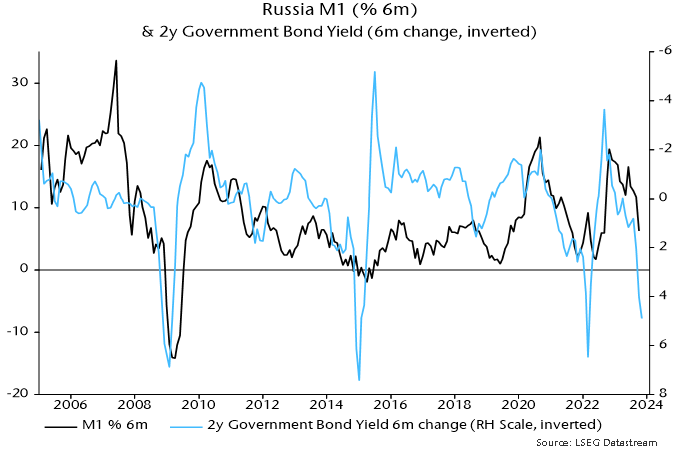
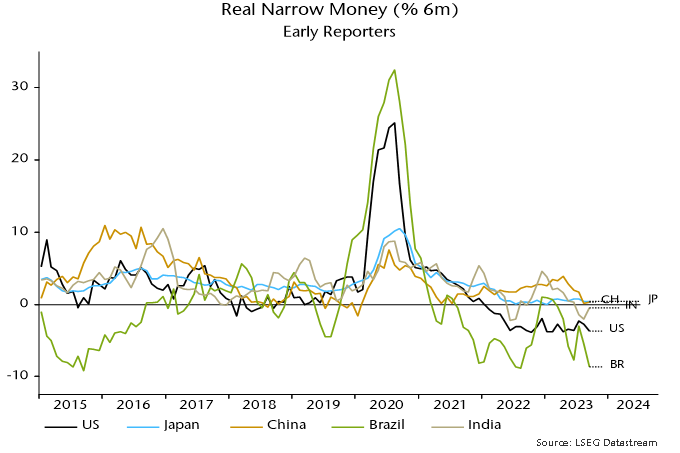
    The rise in money rates is worrying for monetary prospects. Six-month narrow money growth slowed sharply over the summer, a movement judged here to reflect an increase in rates in late 2022 / early 2023 caused by the PBoC withdrawing liquidity on concern about a reopening boost to inflation. 

    Rates fell back between March and August, warranting hopes of a rebound in money growth later in 2023. That prospect has been pushed back and could be cancelled unless rates swiftly reverse the recent rise. 

    Addendum: Another puzzle is that the PBoC has yet to release the results of its Q3 surveys of enterprises, urban depositors and banks, which should have appeared weeks ago based on the historical schedule. The surveys provide important information, e.g. export orders from the enterprise survey is one of the six components of the OECD’s Chinese leading indicator.

    —–
    COMMENT:
    AUTHOR: David Cotton
    EMAIL:
    IP: 78.129.191.50
    URL:
    DATE: 11/03/2023 07:51:06 PM

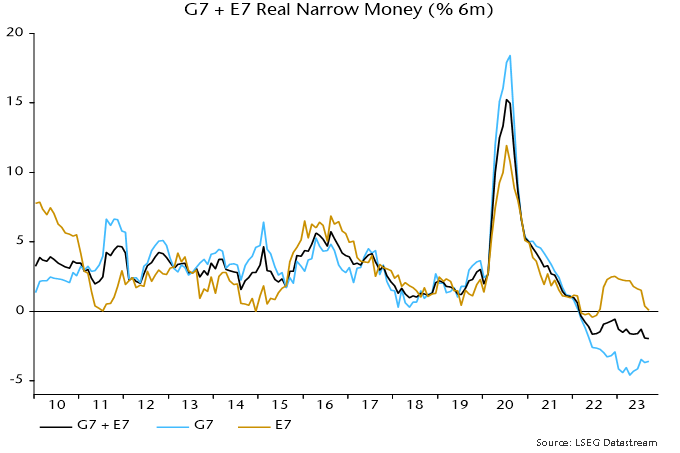
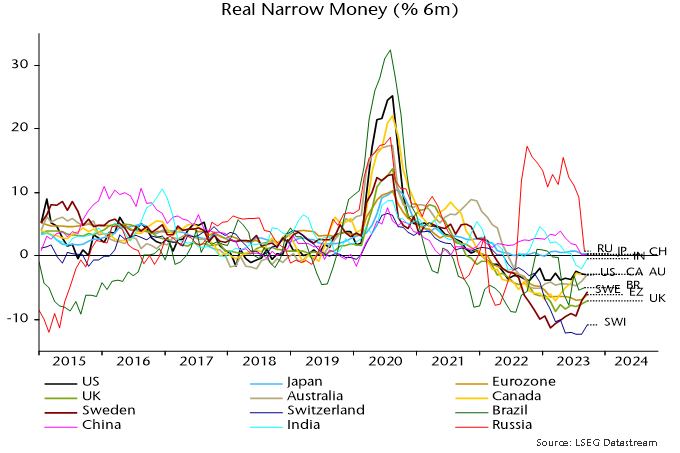
    These monetary developments are particularly troubling in the face of monetary weakness elsewhere.

    Doesn't seem like China will ride to the rescue this cycle.

  • UK M4ex distorted but money trends still alarming

    UK money trends are recessionary / deflationary but not as disastrous as suggested by the Bank of England’s M4ex broad money measure, which plunged 4.2% in the year to September after a 0.6% annual decline in August. 

    M4ex includes money holdings of non-bank financial corporations (excluding intermediaries such as central clearing counterparties, hence M4ex). These holdings surged in September 2022 as LDI funds scrambled to raise cash to meet collateral requirements, creating an unfavourable base effect for the annual M4ex change in September 2023. 

    The long-standing practice here has been to focus on non-financial monetary aggregates, where available, because movements in financial sector money holdings can be erratic and usually have little bearing on near-term economic prospects. 

    Non-financial M4, encompassing money holdings of households and private non-financial businesses, fell by 0.1% between August and September for an annual decline of 0.7% compared with 0.3% the previous month – see chart 1. 

    Chart 1

    The monthly movements in M4ex and non-financial M4 in September were depressed by savers shifting funds out of bank deposits into high-yielding National Savings growth bonds (now withdrawn). The impact of National Savings flows on annual changes has been minor, however: an expanded non-financial measure including National Savings and foreign currency deposits fell by 0.3% in the year to September – chart 1. 

    The LDI crisis distortion to the annual M4ex change will unwind in October / November – money holdings of non-bank financial corporations declined by £51 billion in October / November 2022 after a £65 billion jump in September.

    —–
    COMMENT:
    AUTHOR: David Cotton
    EMAIL:
    IP: 81.150.175.79
    URL:
    DATE: 10/31/2023 06:31:29 PM

    Alarming indeed. I think it would be useful to have a much longer date axis on your charts.

    This cycle is possibly reminiscent of the the late 80s to early 90s that saw significant unemployment and a housing bear market that lasted 6 years.

    —–
    COMMENT:
    AUTHOR: Simon Ward
    DATE: 11/03/2023 02:19:16 PM

    Please see longer-term chart appended to original post.

  • Global real money momentum at new low on BRIC weakness

    Additional monetary information confirms an earlier estimate here that global (i.e. G7 plus E7) six-month real narrow money momentum reached a new low in September, extending a decline from a local peak in December 2022 and suggesting further economic deceleration through spring 2024. 

    The September decline reflects a further fall in E7 momentum, which offset a small G7 recovery and reduced the E7-G7 gap to its narrowest since August 2022 – see chart 1. 

    Chart 1

    E7 and G7 gauges have moved in opposite directions since April. The E7 decline over May-August was driven by China, India and Brazil, with the September fall due to a plunge in Russia – chart 2. Russian weakness is likely to intensify given a recent surge in rates – chart 3. 

    Chart 2

    Chart 3

    The G7 recovery since April has been due to a minor reduction in the pace of nominal narrow money contraction coupled with a further slowdown in six-month consumer price inflation. The change of direction has occurred in most DM economies and momentum remains weaker in the Eurozone / UK than the US, Canada and Australia – chart 2. Still-extreme negative readings argue against much diminution of recessionary prospects. 

    Cross-country S&P Global manufacturing PMI results are broadly consistent with the real narrow money momentum ranking – chart 4 (rank correlation coefficient of latest data points in charts 2 and 4 = 0.85). October PMI falls in India, China, Brazil and particularly Russia may extend given weaker monetary readings. A recent recovery in the US PMI, meanwhile, appears out of line with negative / little changed real money momentum and could reverse (as did the ISM manufacturing PMI last month). 

    Chart 4

  • Hard landing watch: recent data wrap

    October flash PMI results for major developed economies imply little change in the global composite PMI new orders index (released 6 November). The current index level is 1 standard deviation below the long-run average. Weakening real narrow money momentum suggests a further decline through end-Q1 2024 – see previous post.

    What to make of the US GDP surge of 4.9% annualised in Q3? Likely temporary factors contributed (strong government spending, a rebound in stockbuilding). National accounts numbers have jarred with talk of economic strength since end-2021: GDP rose at an annualised rate of 1.2% over the six quarters to Q2 2023, with growth of the alternative income measure at just 0.2%. The Q3 GDP number may represent a statistical catch-up (an income estimate will be released next month). 

    Retail sales / consumption strength is difficult to reconcile with the BEA’s near real-time data on card spending – see chart 1. Similarly, the GDP number appears out of line with PMIs and moderate Q3 growth in private aggregate hours worked (1.7% annualised).

    Chart 1

    Chinese Q3 GDP growth also surprised to the upside but is easier to explain – as payback for a weak Q2. The two-quarter rate of change fell again – chart 2. A decline in six-month real narrow money momentum during Q3 suggests a further slowdown into early 2024. 

    Chart 2

    Verdict: PMIs consistent with soft or hard landing; US GDP strength temporary / erratic; China losing momentum.

    —–
    COMMENT:
    AUTHOR: Sandy
    EMAIL:
    IP: 79.97.146.67
    URL:
    DATE: 10/31/2023 07:38:29 AM

    Simon, it would be interesting to hear the monetarist response to the charge that monetarism 'failed' in the 80s. Bootle raised this yesterday in the Telegraph.

  • Food correction to sustain rapid UK / Eurozone inflation decline

    Changes in household energy bills will cut 1.6 percentage points (pp) from UK annual CPI inflation between September and October, implying a drop from 6.7% to 5.1% if annual rates of increase of other components are unchanged. Slowing food prices promise to lop a further 1.5 pp off annual inflation by early 2024, both directly and via pass-through to the important catering services component. So a minimum expectation is that the headline rate will be back at about 3.5% by next spring, before allowing for likely moderation in other inflation components. 

    The energy bill effect in October reflects the dropping out of a 25% increase in October 2022 along with a 7% cut in the price cap this month. The annual rate of change will swing from 6% in September to -22%. A simple calculation would suggest a 1.3 pp impact on headline CPI inflation, i.e. the 28 pp swing multiplied by a published weight of 4.8%. It turns out that the actual impact is larger because of the way that monthly price changes have interacted with variations in the weight due to relative price movements and basket revisions. 

    Annual inflation of food, beverages and tobacco has moderated but was still up at 11.8% in September. The CPI measure tracks the corresponding PPI component, annual inflation of which is now below 5% (4.5% in September) – see chart 1. 

    Chart 1

    A fall in annual inflation of the CPI food measure to 5% by early 2024 would suggest a 1.1 pp impact on the headline rate, i.e. the 6.8 pp fall from the September multiplied by a published weight of 16.1%*. 

    As the chart shows, however, food prices are also a key driver of the catering services component, which has a 10.9% weight. The beta of this component to food prices has been about 0.5 historically, i.e. the suggested fall of 6.8 pp in annual food inflation would be expected to lower catering services inflation by 3.4 pp, cutting a further 0.4 pp from the headline rate. 

    Central bankers and commentators worried about sticky services inflation underestimate the pass-through effects of energy and food prices. Catering services accounts for 23.4% of the services basket, so the suggested 3.4 pp drop in the annual increase would cut 0.8 pp from annual services inflation (6.9% in September). 

    The above analysis also applies to the Eurozone, although the estimated impacts are smaller because annual inflation of food, beverages and tobacco is lower than in the UK, i.e. 8.8% versus 11.8% in September. 

    As in the UK, a slowdown in the corresponding PPI component suggests a fall in annual food inflation to 5% soon – chart 2. A 3.8 pp reduction would imply a 0.8 pp cut in headline inflation, based on a 20.0% weight. 

    Chart 2

    Eurozone catering services inflation also has a beta of about 0.5 to food prices, so could fall by 1.9 pp. This would cut a further 0.2 pp from the headline rate and 0.4 pp from services inflation (based on weights of 8.4% and 19.2% in the overall and services baskets respectively). 

    So the combined direct and indirect effects of the food slowdown on CPI inflation would be about 1.0 pp in the Eurozone against 1.5 pp in the UK. 

    *As with the energy effect, a detailed calculation yields a slightly larger impact.

  • More negative monetary news

    Global six-month real narrow money momentum – a key leading indicator in the forecasting approach employed here – is estimated to have fallen to another new low in September. Real money momentum has led turning points in global PMI new orders by an average 6-7 months historically, so the suggestion is that a recent PMI slide will extend through end-Q1 – see chart 1. 

    Chart 1

    The September real narrow money estimate is based on monetary data for countries with a two-thirds weight in the global (i.e. G7 plus E7) aggregate and CPI data for a higher proportion. 

    The estimated September fall reflects additional nominal money weakness coupled with a further oil-price-driven recovery in six-month CPI momentum – chart 2. 

    Chart 2

    Among countries that have released September data, six-month real narrow money momentum fell in the US and Brazil, was little changed in China / Japan and recovered in India (because inflation reversed lower after a food-driven spike) – chart 3. 

    Chart 3

    Real narrow money momentum is primarily a directional indicator but the current extreme negative reading seems unlikely to be consistent with hopes of a “soft landing”. 

    One argument for the latter is that a drag on manufacturing trade and activity from a downswing in the stockbuilding cycle is coming to an end, to be followed by a recovery into 2024. A trough by end-2023 has long been the base case here but monetary weakness suggests that the cycle will bump along the bottom rather than enter an upswing. 

    More precisely, an initial boost from an ending of destocking may fizzle as the usual multiplier effects are offset by slower or falling final demand due to monetary restriction. 

    Stockbuilding cycle upswings historically were always preceded by a recovery (of variable magnitude) in global real narrow money momentum – chart 4. 

    Chart 4

    Current conditions are reminiscent of the early 1990s, when real money momentum remained near its low between H2 1989 and H1 1991 and an easing of a stockbuilding drag in 1990 was followed by a relapse into 1991. Monetary weakness, on that occasion, appears to have resulted in an extended cycle, with a final low in Q2 1991 occurring 4 1/2 years after the previous trough in Q4 1986 versus an average cycle length of 3 1/3 years. For comparison, the current cycle started in Q2 2020 so has recently moved beyond the 3 1/3 year average.

    —–
    COMMENT:
    AUTHOR: David Cotton
    EMAIL:
    IP: 78.129.191.50
    URL:
    DATE: 10/17/2023 09:37:16 AM

    Rates need to come down to boost nominal money growth and geopolitical situations need to end to bring down energy prices and inflation.

  • Hard landing watch: US employment report

    US September non-farm payrolls blew through the consensus expectation but the totality of evidence from the employment report suggests that the labour market continues to cool. 

    Including upward revisions to the prior two months, 455,000 jobs were added to the payrolls tally in September. However, this follows three weak months when the revisions-adjusted gain averaged 105,000 – see chart 1. 

    Chart 1

    The alternative household survey employment measure – which counts people rather than jobs – grew at half the pace of payrolls in the three months to September – chart 2.

    Chart 2

    The relative strength of payrolls partly reflects a further rise in multiple job-holding, which is approaching its pre-pandemic peak, i.e. the relative boost may be ending – chart 3. 

    Chart 3

    Stepping back, stronger growth of payrolls than GDP since end-2021 represents a catch-up following a big undershoot of trend during the pandemic – chart 4. 

    Chart 4

    The catch-up appears complete, suggesting that payrolls will resume slower growth than GDP. The slope of the trend line implies a fall in payrolls if GDP growth declines below 1% annualised. 

    Temporary help jobs have led at prior peaks and troughs in payrolls and continued to decline in September – chart 5. 

    Chart 5

    The unemployment rate, meanwhile, held at its higher August level, with the demographic breakdown showing a sharp jump among prime-age males – chart 6. 

    Chart 6

    Verdict: neutral / negative – headline surprise offset by weaker internals.

    —–
    COMMENT:
    AUTHOR: David Cotton
    EMAIL:
    IP: 78.129.191.50
    URL:
    DATE: 10/11/2023 01:38:33 PM

    I am puzzled by falling y/y Federal government current tax receipt combined with pretty reasonable y/y all total non farm employee growth.

  • Hard landing watch: US ISM manufacturing survey

    This is the second in a series of short posts focusing on whether incoming economic news supports or contradicts the forecast of a global “hard landing” suggested by monetary trends.

    The US ISM manufacturing new orders index rose to a 13-month high of 49.2 in September, apparently supporting soft landing hopes.

    A post in July flagged the possibility of a near-term rebound but suggested that this would prove to be a “head fake” preceding a move back below 45. 

    The main reason for expecting a recovery was that the stockbuilding cycle was judged to be moving towards a low, i.e. a drag on new orders from customer inventory adjustment was likely to abate. 

    The reason for expecting the recovery to be brief and followed by a relapse was that US real narrow money momentum remained heavily negative, suggesting that a stockbuilding boost would be outweighed by weakness in final demand. 

    Historical instances of ISM new orders recovering through 50 when real money contraction was negative include 1957, 1970, 1980 and 1990. The orders index subsequently fell back below 45, with the relapses associated with recessions – see chart 1. 

    Chart 1

    Six-month real narrow money momentum has recovered since mid-year but remains significantly negative. 

    The earlier suggestion of a recovery in ISM new orders was supported by a sharp rebound in Korean FKI manufacturing expectations between February and July – Korean exports are sensitive to changes in global industrial momentum. FKI expectations relinquished most of the February-July gain in August / September. 

    Verdict: inconclusive.

    —–
    COMMENT:
    AUTHOR: David Cotton
    EMAIL:
    IP: 82.132.216.242
    URL:
    DATE: 10/04/2023 12:06:12 PM

    Looking at the long end rising. I'd be surprised if nominal money growth doesn't weaken quite a bit more.

    So then should ISM next year.

    —–
    COMMENT:
    AUTHOR: Roberto Rosenfeld
    EMAIL: web@kaught.com
    IP: 99.145.175.100
    URL:
    DATE: 10/04/2023 06:09:25 PM

    Thank you, Simon.

  • Monetary conditions still tightening

    Global six-month real narrow money momentum is estimated to have broken to a new low in August, reinforcing pessimism here about economic prospects and casting strong doubt on now widely-held “soft landing” hopes. 

    Real money momentum bottomed in July 2022, recovered during H2 but suffered a relapse in early 2023, retesting the 2022 low in April. The relapse has been reflected in a renewed downswing in economic momentum, as proxied by global composite PMI new orders – see chart 1. 

    Chart 1

    A tentative stabilisation of real money momentum over the summer suggested that PMI new orders would bottom out around year-end. The further move down in August, if confirmed, signals deeper and more extended economic weakness. 

    The August estimate is based on monetary data covering 70% the global (i.e. G7 plus E7) aggregate and near-complete CPI results. 

    The suggested fall to a new low reflects both additional nominal money weakness and an oil-price-driven recovery in six-month CPI momentum – chart 2. 

    Chart 2

    The ongoing oil price rally suggests a further near-term rise in headline CPI momentum – chart 3. A core slowdown, however, is expected to continue and may accelerate as higher oil costs squeeze spending on other items. 

    Chart 3

    The further fall in real narrow money momentum has been driven mainly by China and India – chart 4. An earlier post attributed Chinese monetary weakness to misguided policy tightening in late 2022, which has since been partially reversed. Chinese August money numbers suggest greater damage from the misstep than previously assumed, implying a more urgent need for additional policy easing. 

    Chart 4

    An August estimate of global industrial output is not yet available but a large negative differential between six-month rates of change of real narrow money and output is likely to have persisted – chart 5. 

    Chart 5

    As previously noted, global equities have underperformed cash since this differential turned negative in early 2022 (allowing for reporting lags), despite a rally over the last 12 months. 

    Why was weakness compressed into the first nine months of 2022, with a subsequent strong rebound? 

    One explanation is that the Ukraine invasion and associated immediate further upward pressure on energy prices exaggerated the market response to monetary deterioration. Positioning and sentiment reached oversold extremes in late 2022, creating the potential for a relief rally as energy markets adjusted and prices fell back. 

    Another possibility – admittedly difficult to assess – is that the “excess” money backdrop has been less unfavourable than suggested by the six-month momentum differential shown in chart 5, because of the existence of an overhang from the 2020-21 monetary surge. An excess stock of money, in other words, may have persisted despite the flow turning negative. 

    The ratio of the stock of real narrow money to industrial output has trended higher over time, with the increase reflected in rising real asset prices and wealth – chart 6. 

    Chart 6

    A huge overshoot in 2020-21 has been correcting since late 2021 but the ratio was still above its pre-pandemic trend at end-2022, i.e. the negative flow differential had not fully offset the prior period of excess.

    The stock and flow signals, however, are now aligned: the real money / output ratio moved below trend in early 2023 and its July level was the lowest since February 2020 before the policy response to the pandemic and subsequent monetary surge.

    —–
    COMMENT:
    AUTHOR: David Cotton
    EMAIL:
    IP: 212.187.244.66
    URL:
    DATE: 09/20/2023 01:04:29 PM

    On equities, firstly the AI mania. Equally weighted indices are less rosy.

    Secondly and most importantly, the lag between economic weakness and labour market weakness.

    We have seen a similar setup to now in H1 2008. Though the Fed had started easing already then.

    —–
    COMMENT:
    AUTHOR: Mywind
    EMAIL:
    IP: 167.114.152.92
    URL:
    DATE: 09/22/2023 08:15:32 AM

    What is the definition of "real narrow money"?
    What is the difference between "real narrow money" and "narrow money"?

    —–
    COMMENT:
    AUTHOR: Simon Ward
    DATE: 10/04/2023 02:25:21 PM

    Real = adjusted for inflation. Narrow money = M1 = currency in circulation + overnight deposits. Real narrow money = narrow money deflated by consumer prices.

  • Eurozone / UK inflation tracking optimistic “monetarist” forecast

    Eurozone / UK CPI momentum continues to normalise in line with the profile of broad money growth two years ago, a relationship suggesting a return of annual inflation to target in 2024 and an undershoot in 2025.

    The six-month annualised rate of increase of Eurozone consumer prices (ECB seasonally adjusted measure) was stable at 3.3% in September but core momentum (i.e. excluding energy, food, alcohol and tobacco) posted another hefty fall from 4.0% to 3.4%, the lowest since January 2022 – see chart 1. 

    Chart 1

    The current rates of increase are consistent with broad money momentum two years earlier: six-month growth of non-financial M3 had slowed significantly but still ran at about 6% annualised during H2 2021. 

    Broad money growth of 4-5% pa is compatible with the 2% inflation target over the medium term. (The ECB’s “reference value” for M3 growth under the now-demolished monetary pillar was 4.5% pa.) Six-month momentum moved into this range from Q2 2022, suggesting that the six-month rise in prices will return to about 2% annualised around Q2 2024, with annual inflation following later in the year. 

    The six-month rate of change of broad money broke decisively below 4% annualised in early 2023, moving into contraction in May. The message is that CPI momentum is on course to undershoot in 2025 unless the ECB reverses policy tightening and generates an early / significant rebound in money momentum. 

    The six-month annualised rate of increase of UK seasonally-adjusted consumer prices slowed sharply in August but was still above the Eurozone level, at 4.4% versus 3.3% – chart 2. UK and Eurozone six-month broad money growth was identical in August 2021 (6.1% annualised) but earlier strength had been more extreme in the UK, possibly contributing to higher current inflation. 

    Chart 2

    Six-month broad money momentum, however, fell more sharply in the UK than the Eurozone in late 2021, while the UK increase broke below 4% annualised six months earlier, in July 2022. The suggestion is that the UK inflation decline will catch up with or move ahead of Eurozone progress over the next six to 12 months.