Eurozone / UK July money numbers offer further support to the assessment here that ECB / Bank of England policy tightening has been excessive and – unless reversed swiftly – will cause unnecessarily severe economic weakness and a medium-term inflation undershoot.
The latest releases are astonishing in several respects.
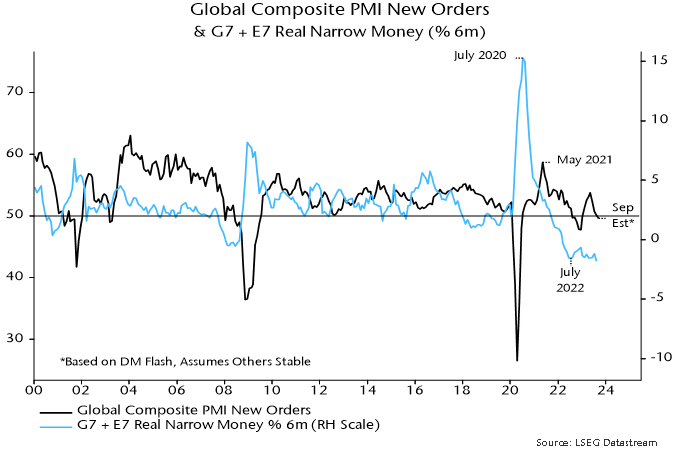
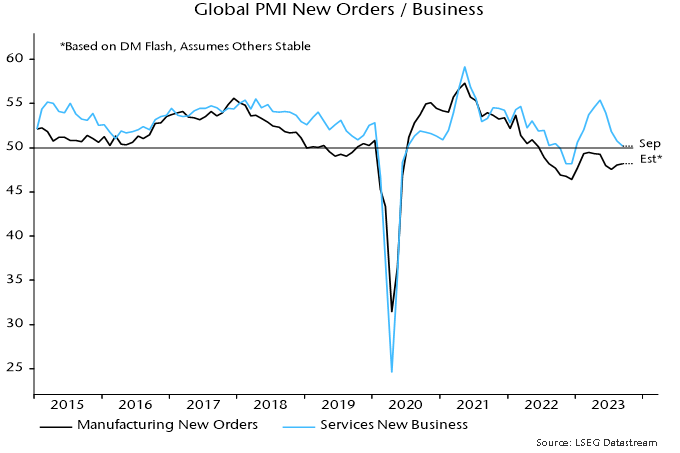
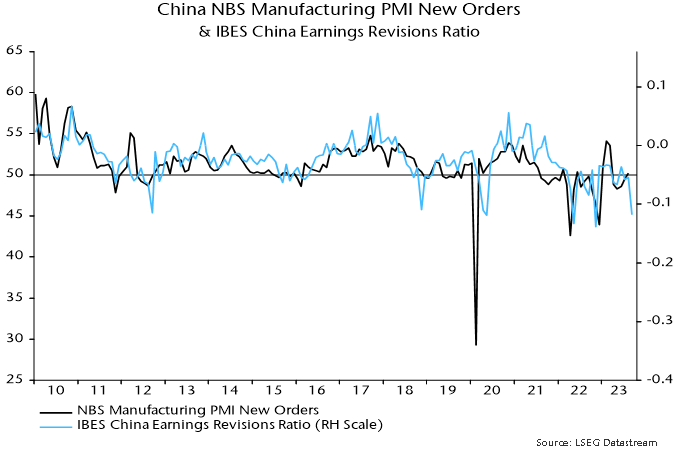
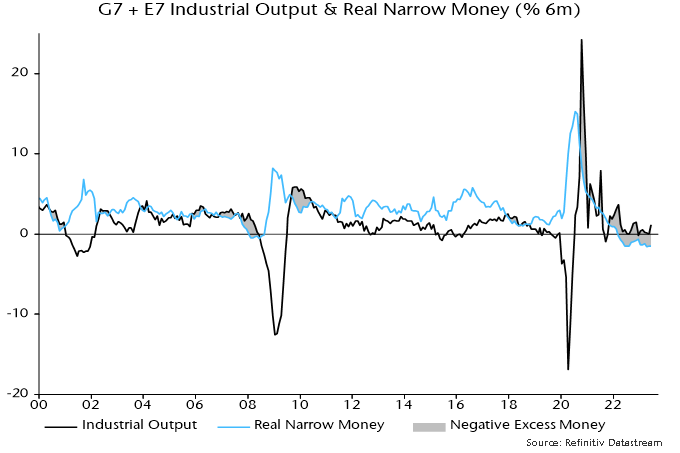
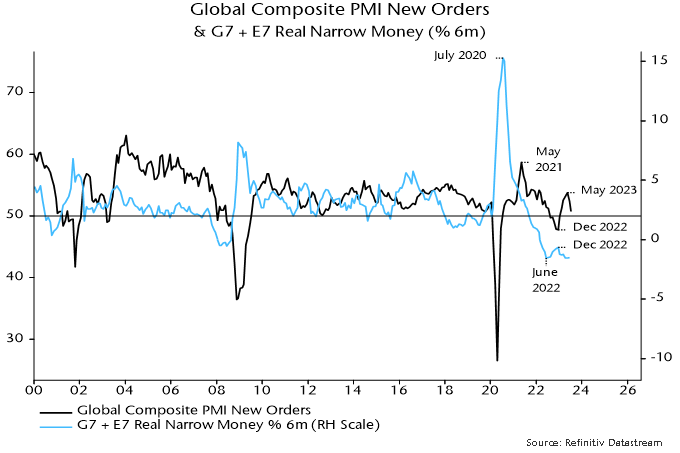
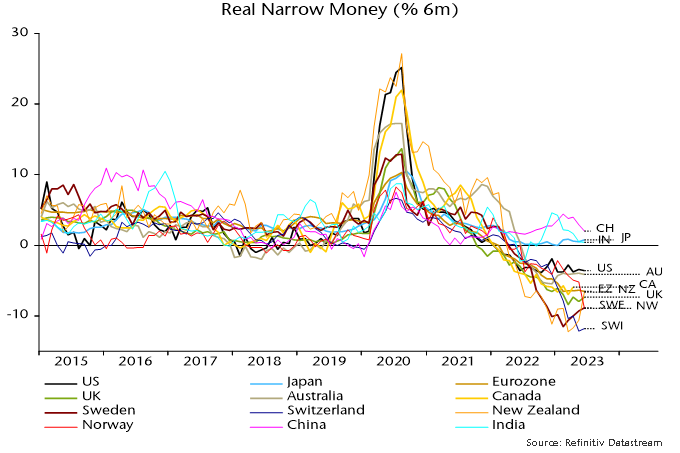
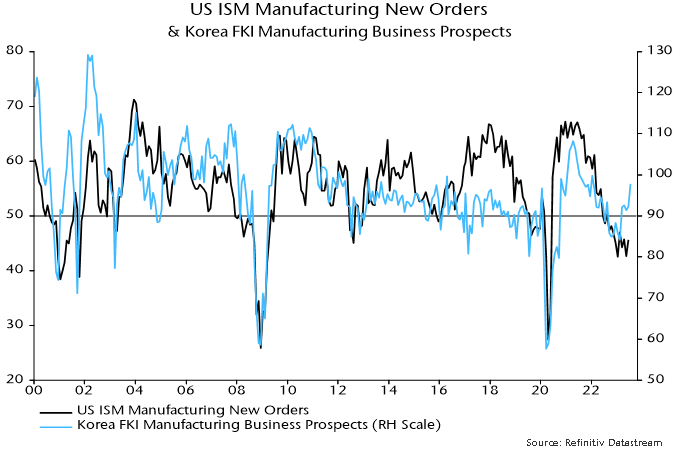
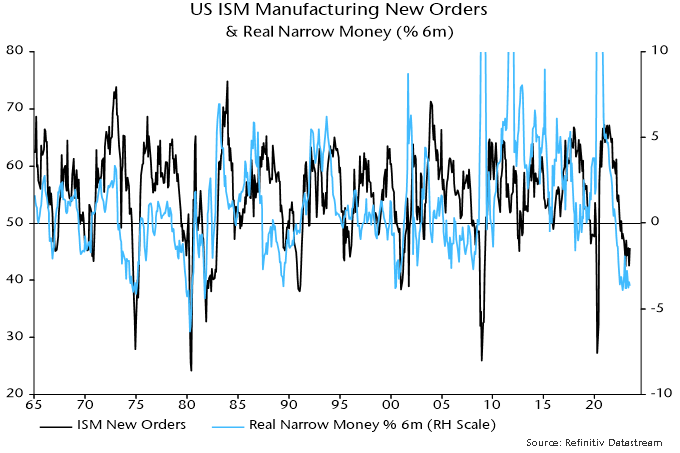
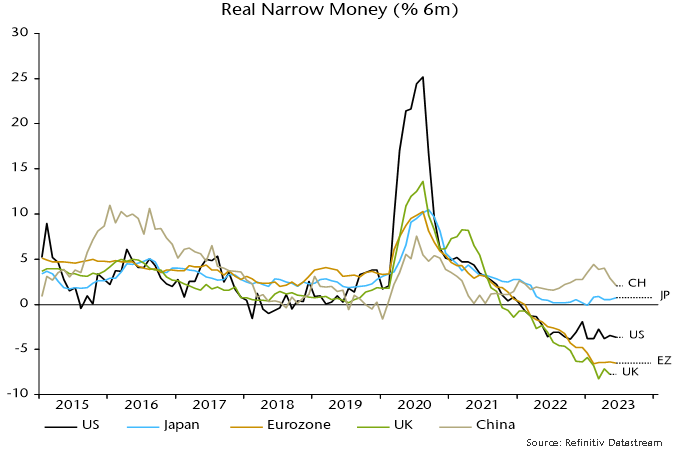
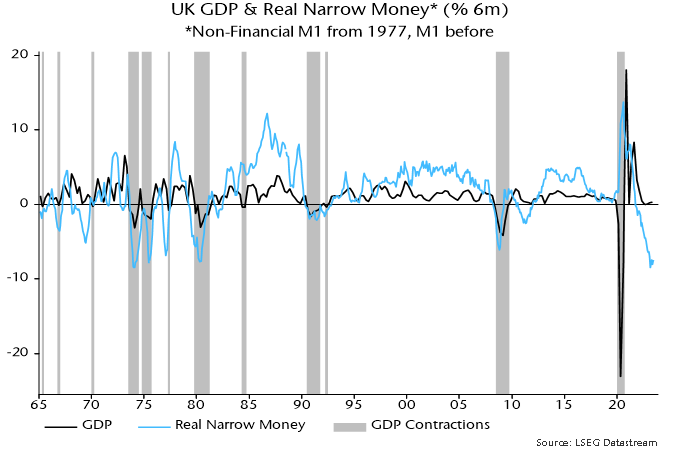
Six-month real narrow money momentum hit a new low in the Eurozone in July and is even weaker in the UK despite a recent boost from falling six-month CPI inflation. Readings are much worse than elsewhere and historically extreme – see charts 1-3.
Chart 1
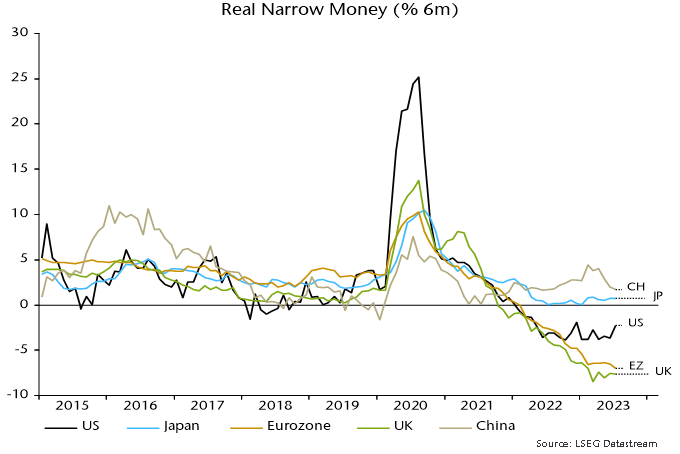
Chart 2
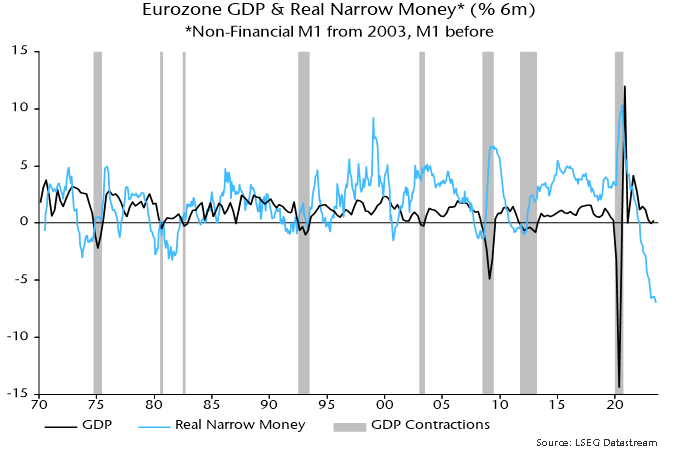
Chart 3
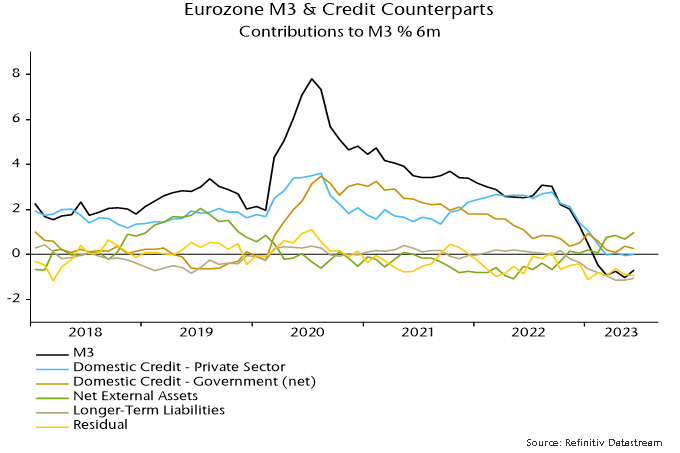
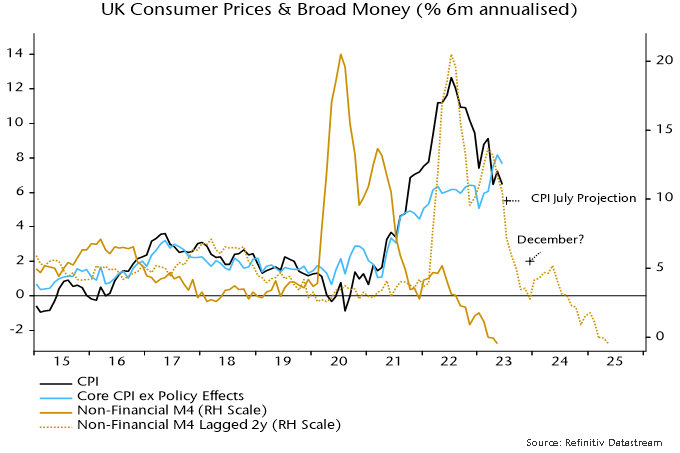
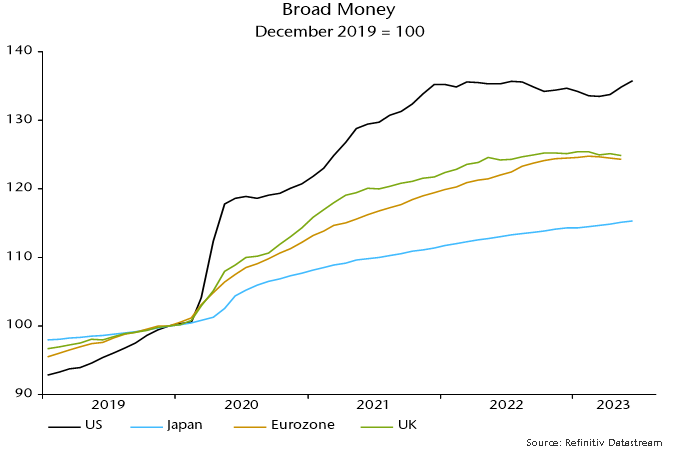
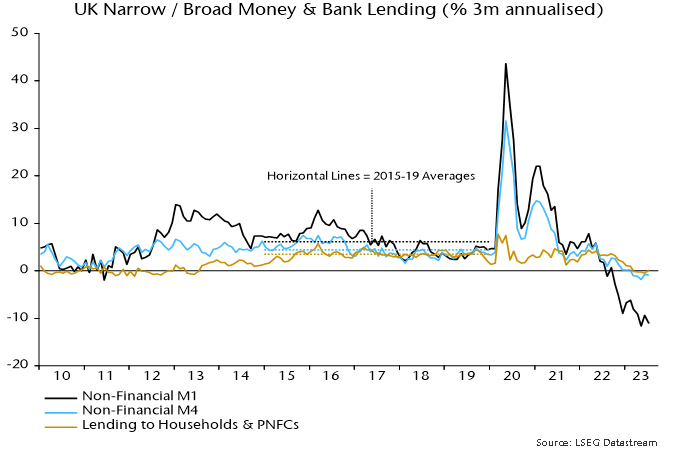
Broad money has followed narrow into nominal contraction. The preferred broad measures here, i.e. Eurozone non-financial M3 and UK non-financial M4, fell at annualised rates of 0.8% and 0.9% respectively in the three months to July – charts 4 and 5.
Chart 4
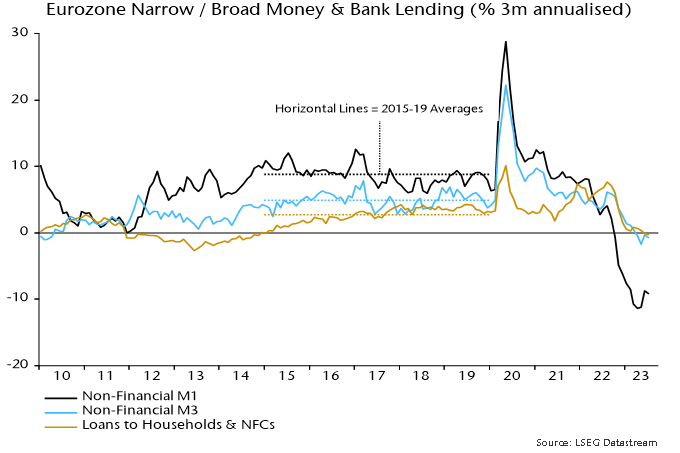
Chart 5
Broad money declines are rare: since 1970, the Eurozone / UK three-month changes were negative only for a brief period around the GFC, with the falls of similar magnitude to recently.
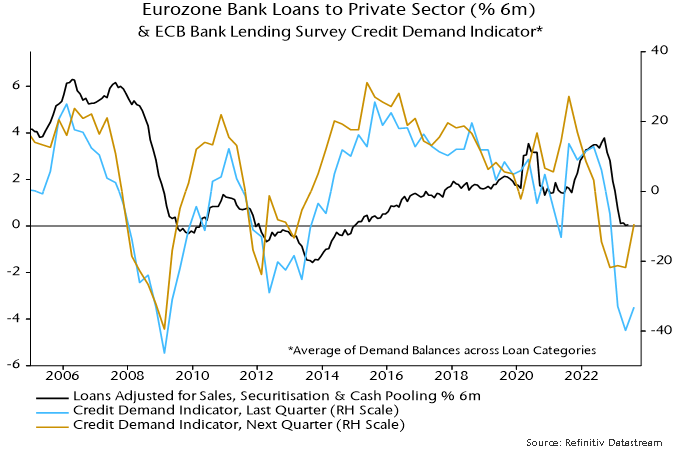
Money leads the economy while credit is coincident / lagging. Bank lending to households and non-financial firms is starting to contract, consistent with recessions being under way – charts 4 and 5.
A further notable feature of the Eurozone data is a widening divergence between still-rising bank deposits in Germany and falls elsewhere – chart 6.
Chart 6
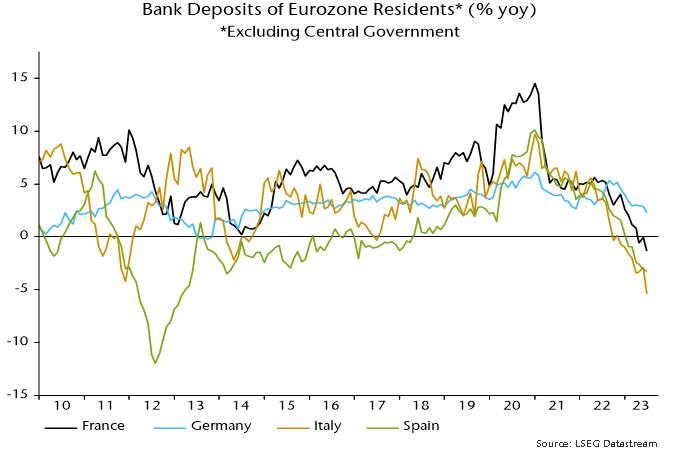
A similar core / periphery monetary divergence in 2011 warned of an escalating Eurozone crisis. The driver then was capital flight from the periphery, reflected in a ballooning of national central bank TARGET deficits / surpluses.
The Bundesbank’s TARGET surplus has fallen recently. Rather than capital flows, the relative resilience of German broad money is explained by less pronounced weakness in bank lending – chart 7.
Chart 7
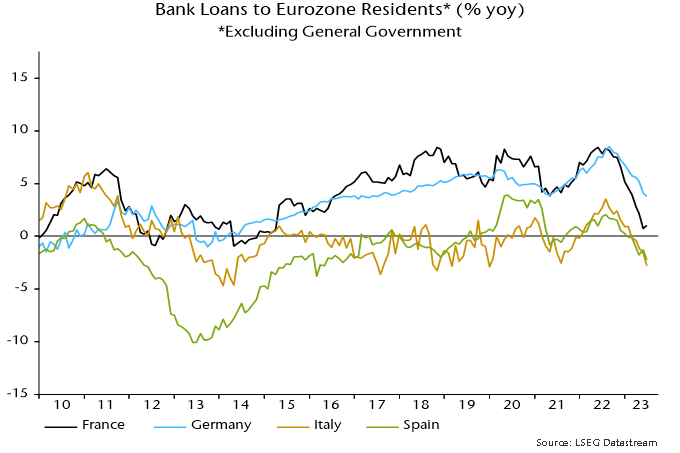
So money / credit trends suggest that economic prospects in the rest of the Eurozone are at least as bad as in Germany.
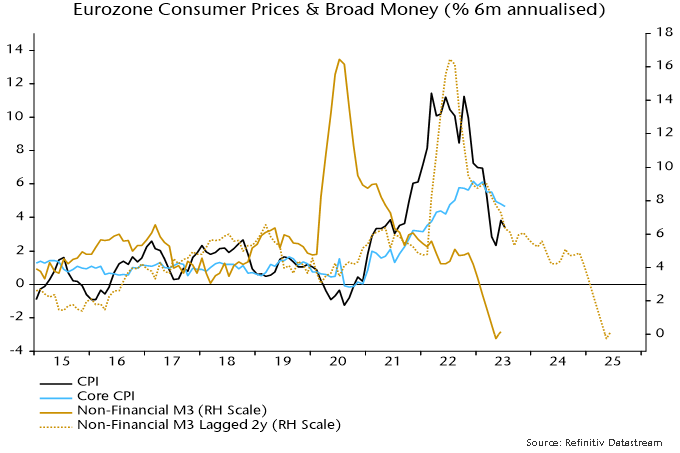
Eurozone six-month CPI momentum, meanwhile, continues to track a simplistic monetarist forecast based on the profile of broad money growth two years earlier – chart 8. Six-month headline momentum was unchanged at 3.3% annualised in August but core slowed further to 4.0%, a 17-month low.
Chart 8
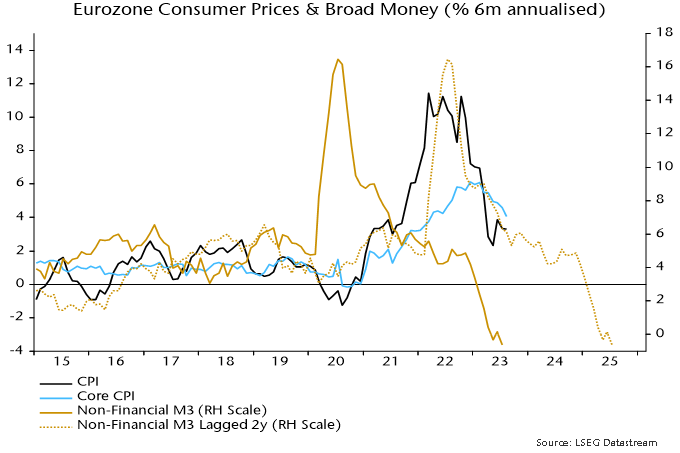
The suggestion is that six-month headline momentum will reach 2% next spring, with the annual rate following during H2. A subsequent significant undershoot is indicated unless recent monetary weakness is reversed.
—–
COMMENT:
AUTHOR: David Cotton
EMAIL:
IP: 78.129.191.50
URL:
DATE: 08/31/2023 05:00:19 PM
Yes, it's hard to imagine anything other than a severe recession from this data. I do think nominal money trends will better represent relative fortunes of economies.
—–
COMMENT:
AUTHOR: Jan Leroy
EMAIL:
IP: 178.119.235.25
URL:
DATE: 09/02/2023 11:07:25 AM
Isn't current monetary weakness just the mirror image of the gigantic increase during the lockdowns? So it's negative without any doubt but perhaps not as disastrous for economic growth just as the boom didn't lead to extreme GDP growth?
—–
COMMENT:
AUTHOR: Jesús Lozano
EMAIL: contacto@saldematrix.es
IP: 79.148.13.24
URL: http://www.saldematrix.es
DATE: 09/03/2023 05:28:16 AM
Hi Simon,
first of all excellent post, as usual.
I have got one question. You say that money leads the economy, beeing credit alagging indicator.
But I thought that Money is created when new credit is created, so i'm a litle bit confused on where is money creted ir there is no credit in the economy.
Thanks in advance.
—–
COMMENT:
AUTHOR: Simon Ward
DATE: 09/13/2023 08:53:30 AM
Thanks for the questions.
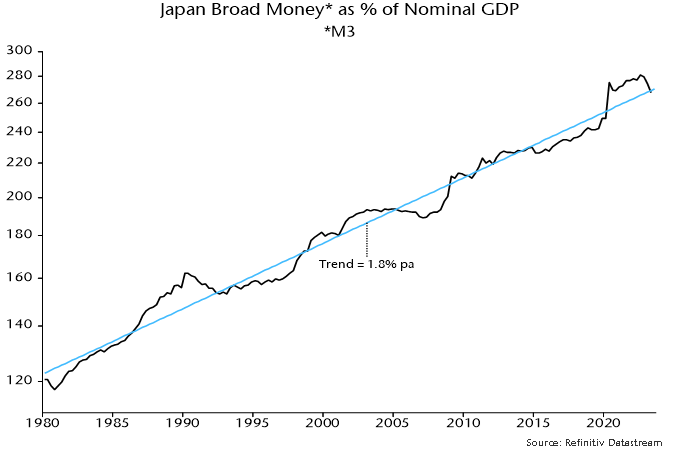
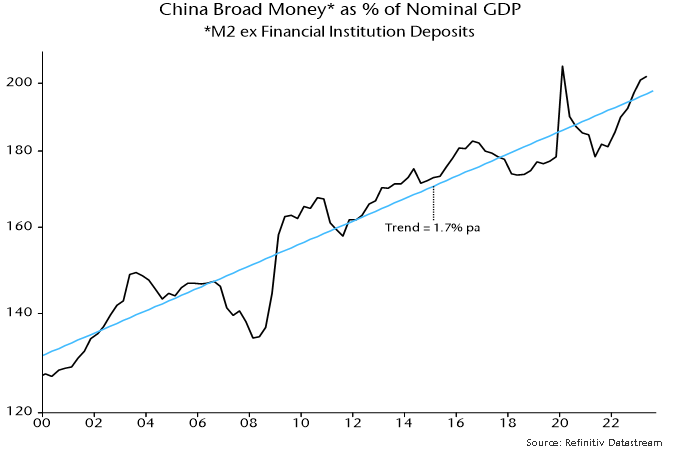
Jan – 1) The monetary boom led to extreme nominal GDP growth. 2) The latter combined with subsequent monetary weakness has resulted in the ratio of broad money to nominal GDP falling below its pre-pandemic trend in both the Eurozone and UK, i.e. money balances were in excess two years ago but are deficient now. 3) Further monetary weakness is likely until policies reverse so the deficiency may grow despite a move into recession and sharply falling inflation.
Jesús – Money creation reflects several “credit counterparts”, not just lending to the private sector. Specifically, broad money = bank lending to the private sector + lending to the public sector + net lending to overseas – banks’ non-deposit funding. The other counterparts are responsible for the lead at turning points, offsetting lagging private credit. For example, recessions are usually associated with a wider fiscal deficit and an improvement in the basic balance of payments position, with the former likely to be reflected in increased bank lending to the public sector and the latter in a rise in overseas assets. Meanwhile, non-deposit funding may fall as economic weakness hits banks’ retained earnings and the prospect of interest rate cuts discourages them from issuing longer-term debt.