Category: Money Moves Markets

  • “Sahm rule” signalling UK wages slowdown

    The Sahm rule states that the (US) economy is likely to be in recession if a three-month moving average of the unemployment rate is 0.5 pp or more above its minimum in the prior 12 months. 

    The rule identified all 12 US recessions since 1950 but gave two false positive signals based on current (i.e., revised) unemployment rate data (1959 and 2003) and four based on real-time data (additionally 1967 and 1976). 

    The signal occurred after the start date of the recession in all 12 cases, with a maximum delay of seven months* (in the 1973-75 recession). 

    The Sahm condition hasn’t yet been met in the US – the unemployment rate three-month average was 3.6% in June versus a 12-month minimum of 3.5%. 

    The rule has, however, triggered a warning in the UK, where the jobless rate averaged 4.0% over March-May, up from 3.5% over June-August 2022. 

    UK Sahm rule warnings occurred on nine previous occasions since 1965, six of which were associated with GDP contractions. 

    The Sahm signal is another indication that the UK economy is already in recession – see previous post – but a stronger message is that earnings growth is about to slow. 

    Annual growth of average earnings fell after the Sahm signal in eight of the nine cases, the exception being the 2020 covid recession, when earnings numbers were heavily distorted by composition effects – see chart 1. 

    Chart 1

    Previous generations of monetary policy-makers understood the dangers of basing decisions on the latest inflation and / or earnings data, which reflect monetary conditions 18 months or more ago. 

    The current reactive approach, apparently endorsed by the economics consensus, may partly reflect mythology about a 1970s “wage / price spiral”. Rather than causing each other, high wage growth and inflation were dual symptoms of sustained double-digit broad money expansion. 

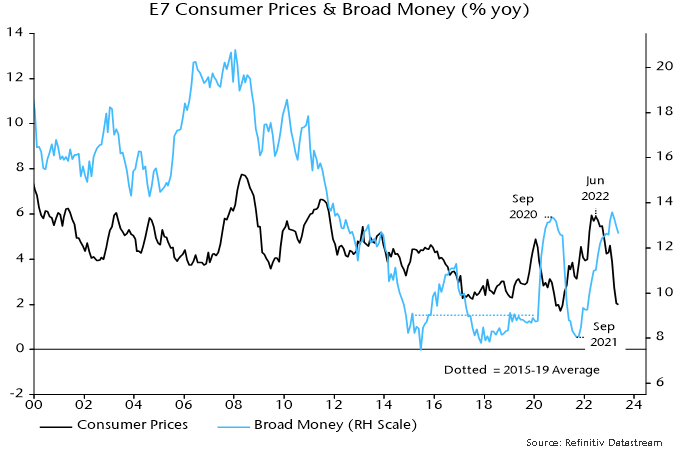
    The monetarist case is summarised by chart 2, showing that earnings growth is almost coincident with core inflation whereas broad money expansion displays a long lead. (The correlations with core inflation are maximised with lags of four months for earnings growth and 24 months for money growth.) 

    Chart 2 

    Recent monetary weakness argues that core inflation and wage growth will be much lower by late 2024; the Sahm rule signals that the decline is about to start.

    *Eight months taking into account a one-month reporting lag.

    —–
    COMMENT:
    AUTHOR: David Cotton
    EMAIL:
    IP: 85.255.236.227
    URL:
    DATE: 07/14/2023 10:40:30 AM

    We'll likely find out who is correct in the next 12 months and my view is it's not likely to be a pleasant experience!

    On another note, Ecri GDPplus and US unadjusted continuing claims increases off the lows makes me think the US is probably in recession already as well.

  • UK recession gauge in red zone before Q2 rate hikes

    A recession likelihood gauge placing weight on monetary variables indicates a high probability of a contraction in UK GDP / gross value added (GVA) over the remainder of 2023. 

    The indicator, regularly referenced in posts here, is based on a model that generates projections for the four-quarter change in GVA three quarters in advance using current and lagged values of a range of monetary and financial inputs. 

    Using data up to June 2022, the model assigned a 70% probability to the four-quarter change in GVA being negative in Q1 2023. The current ONS estimate of this change is +0.2%. 

    The probability reading rises to 96% incorporating data through March 2023, i.e. there is a 96% likelihood of the four-quarter change in GVA in Q4 2023 being negative, according to the model. 

    The statistical analysis underlying the model indicates that GDP prospects are significantly influenced by movements in real narrow money (non-financial M1) and real corporate broad money (M4). Six-month rates of change of these measures have moved deeper into negative territory since mid-2022. 

    The model’s increased pessimism also reflects a deepening inversion of the yield curve and falling real house prices. Other inputs include credit spreads and local share prices, which have yet to display recession-scale weakness.

    —–
    COMMENT:
    AUTHOR: David Cotton
    EMAIL:
    IP: 82.132.214.43
    URL:
    DATE: 06/28/2023 11:54:55 AM

    Hopefully the Fed will give cover for other central banks to cut rates in H2.

    At this stage it's hard for me to imagine them acting unilaterally.

  • PMIs weaken on schedule; earnings next?

    DM flash results released last week suggest that the global manufacturing PMI new orders index fell sharply in June, having moved sideways in April and May following a Q1 recovery – see chart 1. 

    Chart 1

    The relapse is consistent with a decline in global six-month real narrow money momentum from a local peak in December 2022. A recovery in real money momentum during H2 2022 had presaged the Q1 PMI revival. 

    Real narrow money momentum is estimated to have fallen again in May, based on partial data, suggesting further PMI weakness into late 2023. 

    The global earnings revisions ratio has been contemporaneously correlated with manufacturing PMI new orders historically but remained at an above-average level in June, widening a recent divergence – chart 2. 

    Chart 2

    Based on monetary trends, a reconvergence is more likely to occur via weaker earnings revisions than a PMI rebound. 

    Charts 3 and 4 show that revisions resilience has been driven by cyclical sectors – in particular, IT, industrials and consumer discretionary. Notable weakness has been confined to the materials sector. Cyclical sectors may be at greater risk of downgrades if the global revisions ratio heads south. 

    Defensive sector revisions have underperformed recently but are likely to be less sensitive to economic weakness. 

    Chart 3

    Chart 4

    The positive divergence of earnings revisions from the PMI may reflect firms’ ability to push through price increases to compensate for slower volumes. The deviation of the global revisions ratio (rescaled) from manufacturing PMI new orders – i.e. the gap between the blue and black lines in chart 2 – has displayed a weak positive correlation with the PMI output price index historically (contemporaneous correlation coefficient = +0.41). 

    Any earnings support from pricing gains is now going into reverse: the output price index has crashed from an April 2022 peak of 63.8 to 49.8 in May, with DM flash results suggesting a further fall last month.

  • EM leading global inflation decline

    Why believe the “monetarist” forecast that recent G7 monetary weakness will feed through to low inflation in 2024-25? 

    Monetary trends correctly warned of a coming inflationary upsurge in 2020 when most economists were emphasising deflation risk. 

    The forecast of rapid disinflation is on track in terms of the usual sequencing, with commodity prices down heavily, producer prices slowing sharply and services / wage pressures showing signs of cooling. 

    A further compelling consideration is that the monetary disinflation expected in G7 economies has already played out in emerging markets. 

    A GDP-weighted average of CPI inflation rates in the “E7” large emerging economies* crossed below its pre-pandemic (i.e. 2015-19) average in March, falling further into May – see chart 1. 

    Chart 1

    The E7 average is dominated by China but inflation rates are also below or close to pre-pandemic levels in Brazil, India and Russia. 

    Inflation rose by much less in the E7 than the G7 in 2021-22, opening up an unprecedented negative deviation that has persisted. 

    The recent plunge in the E7 measure reflects a significant core slowdown as well as lower food / energy inflation. 

    The divergent G7 / E7 experiences are explained by monetary trends. Annual broad money growth rose by much less in the E7 than the G7 in 2020 and returned to its pre-pandemic average much sooner – chart 2. 

    Chart 2

    E7 broad money growth crossed below the pre-pandemic average in May 2021. CPI inflation, as noted, followed in March 2023, i.e. consistent with the monetarist rule of thumb of a roughly two-year lead from money to prices. 

    G7 broad money growth crossed below its pre-pandemic average in August 2022 and has yet to bottom, suggesting a return of inflation to average in summer 2024 and a subsequent undershoot. 

    E7 disinflation, however, may be close to an end. Annual broad money growth has recovered strongly from a low in September 2021, signalling a likely inflation rebound during 2024 – chart 3. Broad money acceleration has been driven by China, Russia and Brazil. 

    Chart 3

    E7 annual broad money growth is around the middle of its longer-term historical range and has eased since February. Chinese numbers may have been temporarily inflated by a shift in banks’ funding mix in favour of deposits. 

    The expected rise in E7 inflation may not extend far but restoration of a positive E7 / G7 differential is likely in 2024.

    *E7 defined here as BRIC + Korea, Mexico, Taiwan.

    —–
    COMMENT:
    AUTHOR: David Cotton
    EMAIL:
    IP: 78.129.191.50
    URL:
    DATE: 06/22/2023 03:14:30 PM

    It increasingly looks like when rates are finally cut, they will be done so very rapidly.

  • Fed forecasts still suggesting H2 policy shift

    The FOMC’s updated economic forecast for the remainder of 2023 is inconsistent with Committee members’ median expectation of a further 50 bp rise in official rates during H2, according to a model based on the Fed’s past behaviour. Policy is more likely to be eased than tightened if the forecast plays out. 

    The model estimates the probability of the Fed tightening or easing each month from current and lagged values of core PCE inflation, the unemployment rate and the ISM supplier deliveries index, a measure of production bottlenecks. It provides a simple but satisfactory explanation of the Fed’s historical decision-making, i.e. the probability estimate was above 50% in most tightening months and below 50% in most easing months – see chart. 

    The probability of the Fed tightening at yesterday’s meeting had been estimated by the model at 36%, the first sub-50% reading since September 2021. (The FOMC started to taper QE at the following meeting in November.) 

    The FOMC’s median forecast for core PCE inflation in Q4 was revised up to 3.9% from 3.6% previously (currently 4.7%). The unemployment rate forecast was lowered to 4.1% from 4.5% (currently 3.7%). 

    The model projections shown in the chart assume that core PCE inflation and the unemployment rate converge smoothly to the Q4 forecasts, while the ISM supplier deliveries index remains at its current level. Despite the revisions, the probability estimate still falls to below 10% in Q4, consistent with the Fed beginning to ease by then. 

    The projections highlight the Fed’s historical sensitivity to the rates of change of core inflation and unemployment as well as their levels. It would be unusual for policy-makers to continue to tighten when inflation and unemployment are trending in the “right” directions, especially given the magnitude of the increase in rates to date. 

    One difference from the past is that Fed now forecasts its own actions. Has yesterday’s guidance that rates have yet to peak boxed policy-makers into at least one further rise? This may mean that the model’s probability estimate for July – currently 29% – is too low. Still, next month’s decision will hinge on data, with inertia plausible barring stronger-than-expected news.

    —–
    COMMENT:
    AUTHOR: David Cotton
    EMAIL:
    IP: 81.150.175.79
    URL:
    DATE: 06/15/2023 05:14:35 PM

    Perhaps pencil in a rate cut for September?

    Escalation of commitment, the 1970s narrative and possibly optimistic data from the BLS and BEA could delay it further.

    Ultimately, delaying rate cuts probably means they'll then be bigger and faster later.

  • Is services resilience about to crumble?

    Global growth optimists expect continued solid services sector expansion to offset manufacturing weakness. PMI results for May appear, on first inspection, to support this view: services activity and new business indices rose further to 18- and 22-month highs respectively even as manufacturing new orders remained stalled below 50 – see chart 1. 

    Chart 1

    There are, however, several reasons for discounting the strong headline services readings. 

    First, backlogs of services work fell sharply to a four-month low despite stronger new business – chart 2. This suggests that current output is running ahead of incoming demand, in turn implying a future adjustment lower unless demand picks up further. 

    Chart 2

    Manufacturing backlogs also fell sharply last month, breaking below their November 2022 low. 

    Secondly, the sectoral breakdown of the activity and new business indices shows that May rises were driven by a surge in financial services – chart 3. Consumer services indices eased on the month. Financial services strength is difficult to understand given monetary stagnation, slowing bank lending and flat trading volumes, so may prove short-lived. 

    Chart 3

    Thirdly, the high May readings of the global activity and new business indices reflect strong contributions from the US and Chinese components but national services surveys are significantly weaker. 

    The US ISM services activity index fell to a three-year low in May even as the S&P Global equivalent series reached a 13-month high – chart 4. 

    Chart 4

    The Chinese NBS non-manufacturing new orders index moved below 50 in April and fell further in May, in puzzling contrast to the S&P Global / Caixin services new business index, which reached its second-highest level since November 2020. 

    The global manufacturing new orders and services new business indices have been strongly correlated historically but statistical tests indicate a tendency for manufacturing to lead services rather than vice versa*. With global monetary trends continuing to give a negative economic signal, the current unusually wide gap is more likely to be closed by services weakness than a manufacturing revival. 

    *In regressions using monthly data with three lags, lagged manufacturing new orders terms are significant in the regression for services new business, but lagged services new business terms are insignificant in the regression for manufacturing new orders.

  • Global weakness tempered by EM resilience

    Monetary trends continue to give a negative message for global economic prospects, suggesting that European / US weakness will outweigh resilience in major EM economies. 

    G7 plus E7 six-month real narrow money momentum fell again in April, extending a move down from a local peak in December and suggesting a decline in economic momentum through late 2023 – see chart 1. 

    Chart 1

    A revival in real narrow money momentum in H2 2022 was reflected in a recovery in global manufacturing PMI new orders between December and March. The recovery stalled in April / May and the forecast here remains for a relapse and possible retest of the December 2022 low during H2 2023. 

    Narrow money has outperformed broad money as a leading indicator historically, in terms of reliability in signalling turning points in economic momentum. Narrow money usually weakens relative to broad money when interest rates rise as depositors are incentivised to shift funds to less liquid accounts. This is an important feature of the transmission mechanism and one of the reasons narrow money outperforms as a forecasting indicator. 

    An argument, however, has been made that the unusual speed of the rise in interest rates over the past year, coupled with worries about deposit safety following recent bank failures and an associated switch into money market funds, may have exaggerated narrow money weakness relative to “true” economic prospects. This would suggest giving greater weight to broad money trends at present. 

    As chart 1 shows, global six-month real broad money momentum recovered more strongly during H2 2002 and has stalled rather than fallen back since December. Still, the message for economic prospects is weak, suggesting no growth revival before 2024. 

    A marginal decline in global manufacturing PMI new orders in May reflected a notable weakening of the DM component offset by stronger EM results. EM resilience is consistent with recent stronger E7 real money momentum (broad as well as narrow) – chart 2. 

    Chart 2

    Charts 3 and 4 show six-month real narrow money momentum and manufacturing PMIs in selected major economies. Russia, China and India top the real money momentum ranking with weakness focused on Europe – particularly Switzerland and Sweden. The latest PMI results mirror the real money ranking (rank correlation coefficient = 0.85), with recessionary readings in the Eurozone, Switzerland and Sweden contrasting with Indian / Russian strength. 

    Chart 3

    Chart 4

    —–
    COMMENT:
    AUTHOR: David Cotton
    EMAIL:
    IP: 78.129.191.50
    URL:
    DATE: 06/07/2023 03:28:42 PM

    It does rather sound like an argument for why it'll be different this time. Most data suggests it probably won't be but you never know ?

  • UK inflation: don’t panic

    Market reaction to UK April CPI numbers focused on the overshoot of headline and core inflation relative to forecasts, ignoring a continued slowdown in headline price momentum. 

    The six-month rate of increase of headline prices, seasonally adjusted here, fell to 6.6% annualised in April, the slowest since September 2021 and down from a peak 12.6% – see chart 1. 

    Chart 1

    Six-month headline momentum is tracking a simplistic “monetarist” forecast that assumes a two-year lag from money to prices and the same “beta” of inflation to money growth as on the way up. 

    This forecast suggests a further decline in six-month momentum to about 5% annualised in July on the way to much lower levels in late 2023. 

    The projection of a fall to 5% or so in July is supported by a bottom-up analysis incorporating the announced 17% cut in the energy price cap that month. 

    Markets were spooked by annual core inflation reaching a new high of 6.8% in April but it is normal for core to lag headline at turning points. 

    The April result, moreover, is consistent with a mean historical lag of 26 months between peaks in annual broad money growth and core inflation: money growth continued to rise into February 2021 – chart 2. 

    Chart 2

    The suggestion that core inflation is at or close to a peak is supported by PPI data: core PPI output inflation usually leads and has slowed significantly from a May 2022 peak – chart 3. 

    Chart 3

    PPI data also indicate that CPI food inflation is peaking and could fall rapidly over the remainder of the year – chart 4. 

    Chart 4

    —–
    COMMENT:
    AUTHOR: David Cotton
    EMAIL:
    IP: 78.129.191.50
    URL:
    DATE: 05/31/2023 09:20:45 AM

    Near negative nominal broad money growth is what should spook markets!

    —–
    COMMENT:
    AUTHOR: Mitchell Neale
    EMAIL: mitchell.neale@vpwm.co.uk
    IP: 81.79.218.111
    URL:
    DATE: 06/03/2023 11:52:47 AM

    Take a look at the velocity of money and a very different conclusion would be reached.

  • Inflation leading indicators still softening

    It might be expected that G7 central bankers, in attempting to judge inflation prospects and the appropriate policy stance, would be paying close attention to indicators that signalled the recent inflationary upsurge.

    Such indicators include:

    • Broad money growth, which led the inflation increase by about two years.

    • The global manufacturing PMI delivery speed index, a gauge of excess supply / demand in goods markets, which led by about a year.

    • Broad commodity price indices, such as the S&P GSCI, which displayed a sharp pick-up in momentum six to 12 months before the inflation upsurge.

    Indicators that provided little or no warning of inflationary danger include measures of core price momentum, wage growth, labour market tightness and inflation expectations, i.e. indicators previously cited to argue that an inflation rise would be “transitory” and now being used to justify continued policy tightening.

    Chart 1 shows G7 CPI inflation together with the three informative indicators listed above, with appropriate lags applied.

    Chart 1

    The three indicators have fallen far below pre-pandemic levels, suggesting that CPI inflation rates will return to targets – or undershoot them – in 2024.

    Core inflation and wage growth moved up more or less in tandem with headline inflation during the upswing. Hawkish central bankers need to explain why they expect an asymmetry on the way down.

    A possible “monetarist” argument for inflation proving sticky is that the stock of money remains excessive relative to the price level. The judgement here is that any overhang is small and – with monetary aggregates stagnant / contracting – will soon be eliminated.

    The G7 real broad money stock is 3% above its 2010-19 trend, down from a peak 16% deviation in May 2021 – chart 2.

    Chart 2

    While agreeing on the destination, the indicators are giving different messages about the speed of decline of inflation.

    The PMI delivery speed indicator and commodity prices are more relevant for goods prices, with recent readings consistent with the expectation here of goods deflation later in 2023.

    Broad money trends, by contrast, suggest a temporary slowdown in the rate of decline of CPI inflation during H2, reflecting a stabilisation of money growth during H2 2001. This resulted from a reacceleration of US broad money following disbursement of a third round of stimulus payments.

    A possible reconciliation is that the bulk of a fall in services inflation will be delayed until 2024. Such a scenario would suggest a slower reversal of policy rates and an extension of real money weakness, with negative economic implications.

    —–
    COMMENT:
    AUTHOR: Adam H
    EMAIL:
    IP: 165.225.81.104
    URL:
    DATE: 05/24/2023 03:37:57 PM

    Could the asymmetry come from a change in expectations post the step change in headline rates? Thanks

    —–
    COMMENT:
    AUTHOR: Simon Ward
    DATE: 06/01/2023 03:11:43 PM

    In theory, yes, if expectations of inflation remaining elevated resulted in the velocity of circulation trending higher. Sustained high inflation would then be consistent with low money growth. This seems a very unlikely scenario and different from the 1970s, when high inflation and inflation expectations reflected sustained high money growth.

  • Navigating a coming turn in the stockbuilding cycle

    The stockbuilding cycle is on course to bottom soon and upturns have historically been associated with a procyclical shift in market behaviour. Several considerations, however, argue for caution about positioning for such a shift now. 

    The key indicator used to monitor the cycle here is the annual change in G7 stockbuilding expressed as a percentage of GDP, shown in chart 1. Lows were reached every 3 1/3 years on average, which matches the 40-month periodicity reported by the “discoverer” of the cycle, Joseph Kitchin, in 1923. 

    Chart 1

    The stockbuilding cycle is a key driver of industrial fluctuations: the correlation coefficient of the above series and contemporaneous G7 annual industrial output growth over 1965-2019 was 0.75.

    The last cycle low was in Q2 2020 so the next could occur in H2 2023, based on the average cycle length. Partial Q1 information – an estimate is included in chart 1 – indicates that the downswing is well advanced, consistent with the cycle entering a window for a low. 

    Cycle lows often mark a change in the market environment from risk-off / defensive to risk-on / cyclical, e.g. the price relative of cyclical equity market sectors versus defensive sectors has bottomed around the same time as the cycle historically – chart 2. 

    Chart 2

    So should investors start adding cyclical exposure? There are several reasons for caution. 

    First, stockbuilding has fallen sharply but only to a “normal” level by historical standards. Further weakness seems likely given the extent of overaccumulation in 2021-23. 

    Second, a monthly inventories indicator derived from business surveys, which is more timely and usually leads by several months, has yet to signal a turning point – chart 3. 

    Chart 3

    Third, and most importantly, stockbuilding cycle recoveries historically were preceded by a pick-up in real narrow money momentum, which remains very weak – chart 4. 

    Chart 4

    The price to book relative of non-tech cyclical sectors versus defensive sectors is below its long-run average but the divergence is smaller than at most recent stockbuilding cycle lows – chart 5. 

    Chart 5

    There is a risk of another bout of market weakness / cyclical underperformance as the stockbuilding cycle moves into a trough. The judgement here is that a revival in real money momentum is necessary to signal that a cycle low will be followed by a sufficiently solid recovery to boost cyclical assets.

    —–
    COMMENT:
    AUTHOR: David Cotton
    EMAIL: mrwbartholomew@gmail.com
    IP: 82.132.246.167
    URL:
    DATE: 05/24/2023 10:10:55 AM

    Your chart would seem to suggest a bottom in the cycle around q4 with a mirroring decline from the peak. The cycle should net to zero in the long term ?

    —–
    COMMENT:
    AUTHOR: Simon Ward
    DATE: 06/01/2023 03:09:05 PM

    Yes, the effect should be neutral over the cycle.